


It’s not uncommon for a data engineer to devote 80% of their day to debugging. Dagster radically improves on this.
Data teams spend way too much time fixing broken assets and pipelines.
It’s not uncommon for a data engineer to devote 80% of their day to debugging failures and investigating why data doesn’t look like it should.
This is a problem at small orgs, and an even bigger problem at large orgs, where the root cause of an issue with an ML model can lie in a source table managed by an entirely different team.
Productivity issues for Data and ML Engineers

“At Yelp, some weeks I’d spend multiple days helping the system recover from a single data pipeline failure, and others, I’d spend hours digging through the codebase to track down the source of a data quality issue. Without any real tooling support, these tasks were incredibly time consuming, and it just felt like there had to be a better way.” - Owen

“When I ran an ML team at Keeptruckin, we were building the ship as we were sailing it, which I think is the situation for most data teams. We kept a log of every time we pushed a change that broke the data pipeline in some sort of way. There was a month where it happened almost every single day. It was both incredibly discouraging and enlightening. We used Airflow, and we had no way to test our pipelines before putting them into production.” - Sandy
Both of us can relate first-hand to the Sisyphean challenge of keeping data correct and up-to-date. It’s a large part of what brought us to Dagster Labs – the mission of empowering organizations to build productive data platforms spoke to the problems we’d faced as data and ML engineers at Yelp, Keeptruckin, Clover Health, and Cloudera. Here, we’ve been building Dagster, an orchestration platform that’s designed to directly tackle the productivity issues we’ve grappled with at these companies.
The critical role of orchestrators in debugging
Orchestrators – the systems we use to organize the computations that move and transform our data – play a critical role in data debugging, for a couple main reasons:* Because they’re responsible for scheduling, orchestrators are the source of truth for what ran and what’s supposed to run. Debugging often comes down to untangling what has happened and understanding what was supposed to happen.* Because they’re responsible for ordering computations, orchestrators are the source of truth about what depends on what. Debugging often comes down to tracing problems to their root causes, and that means navigating data dependencies.
We built Dagster around a set of ideas that are critical for troubleshooting problems and keeping bad data out of production:* Dagster pipelines are portable across local, staging, and test environments, which helps catch problems before they make it into production.* It has a first-class asset layer, which allows you to start the debugging process from the tables or ML models that you’re observing problems with, to declare what your data is supposed to look like, and to trace problems via asset lineage.* It brings in and structures logs and metadata from the code and tools that it invokes, meaning teams can quickly understand all of the relevant information related to an error. If something goes wrong with your data, the tool you’re using to move it around should have the most context on what happened.
We both have experience using Airflow, and found that it fell short on all of these. It’s not designed for testability, so teams only bring it in as things move into production, at which point discovering issues is costly. Airflow is task-focused rather than asset-focused, which means you end up needing to constantly translate between the data assets you care about and the tasks that update them. And Airflow's UI doesn’t lend itself to common debugging operations – the logs are unsearchable, unstructured, and unlinked to anything other than the specific task or DAG that they arose from.
Catch bugs before they make it into production
If you can run your data pipeline in a staging environment, you can catch problems before they break production. If you can run it on your laptop, you can iterate on it and quickly catch issues with your business logic. If you can run it in a unit test, you can write a suite that accounts for edge cases and automatically defends against future breakages.
To catch bugs before they make it to production, Dagster encourages running jobs in testing, local development, and staging environments. It does this with (1) programming abstractions that separate business logic from environmental concerns and (2) an execution model that’s extremely lightweight when it needs to be.
Dagster’s programming model encourages the separation of environmental concerns from business logic: with resources, you can plug in different implementations and configuration in different environments. For example, you could connect to a production Snowflake instance in your production environment, your staging Snowflake instance in your staging environment, and mock out Snowflake entirely in a unit test.
By default, Dagster execution is extremely lightweight. You can execute a job within a Python process, without any persistent service up and running. If you want access to Dagster’s UI, you can spin it up with a single command and don’t need to run a database or connect to any services in the cloud. Dagster’s executor abstraction makes execution pluggable, which means the same graph of assets that runs within a single process in a test can run distributed across a K8s cluster in production.
Dagster also exposes APIs for testing every one of its abstractions: if you write a custom sensor or scheduling policy, you can test it in a lightweight way. You can invoke ops and software-defined assets like they’re regular Python functions.
If you’re using Dagster+, Branch Deployments take this to a whole new level. Each time you push a change up to Github, we’ll provision a deployment for it where you can inspect your graph, run jobs, and materialize assets in a realistic environment that’s isolated from production.
Debugging starts with the asset
Data assets like tables, ML models, and reports are the core entities of the data platform. We’d often learn of errors directly from business users who noticed an issue in the data they were consuming. The messages we got were never “I think there’s a bug in this processing logic.” or “Hey, we see this task failed.” Rather they would tell us that a number looked wrong, or a table seemed out of date.
Even if every pipeline is running smoothly, the job of a data engineer is not to ensure that tasks successfully run, it’s to provide high quality data to other teams. A task can run successfully a hundred times and silently produce incorrect data on every single run.
Dagster’s asset layer lets you think about assets first and tasks when you need to. Here’s the page that Dagster hosts for a table called “logins”. You can find this page by searching for the table name and then use it to see what assets it depends on, the history of runs that updated it, when it’s scheduled to be updated next, what partitions are missing, the columns it’s expected to have, and so on. You can identify whether it was built using a stale version of the upstream asset it depends on. If it looks out-of-date, you can click the “Materialize” button to launch a run to update it.
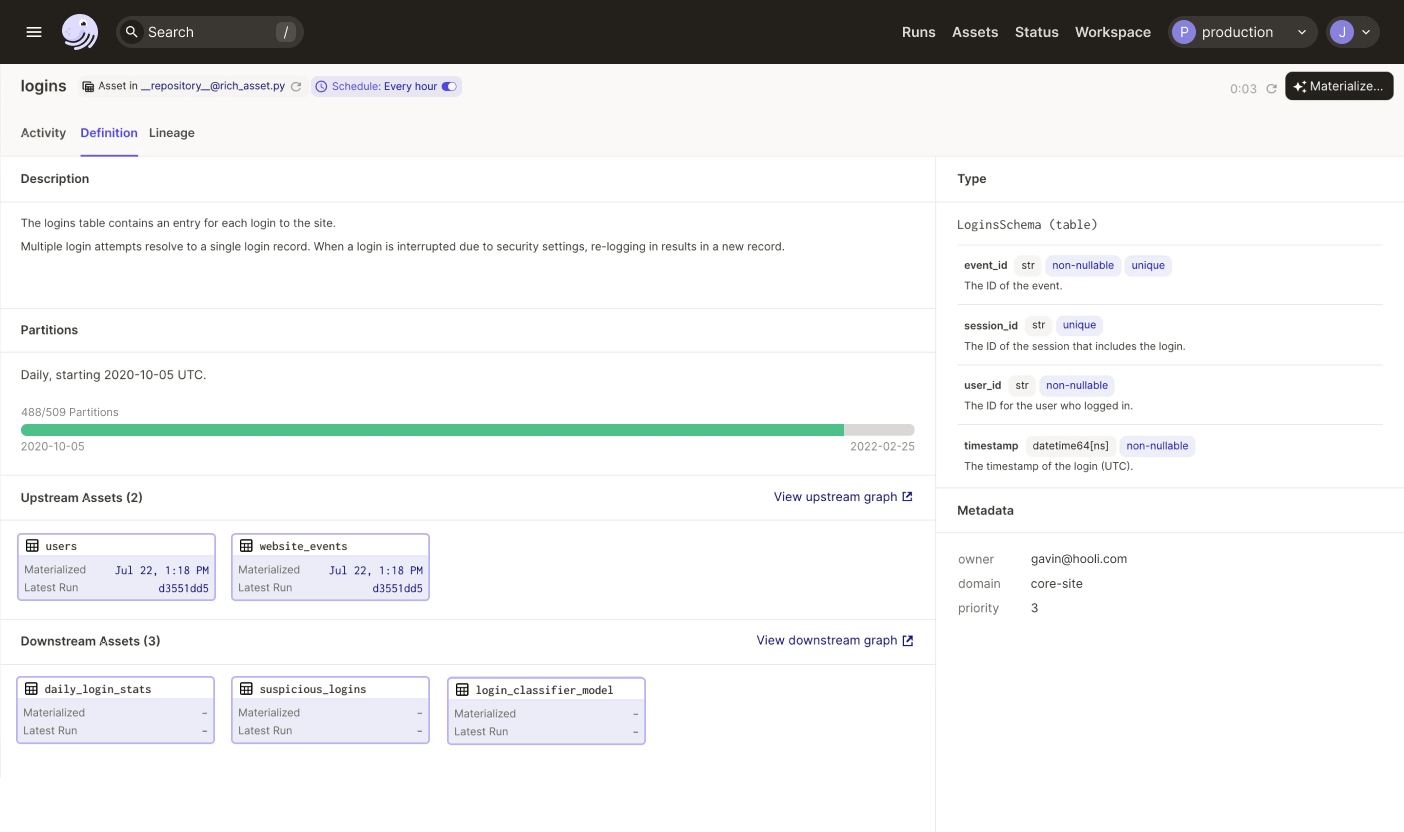
Dagster doesn’t require users to adopt an asset-centric approach, but locating problems becomes a lot more straightforward when you do. Expressing, in metadata, what the data should look like sets up a blueprint for analysis that a human operator can use as a guide to debug much faster.
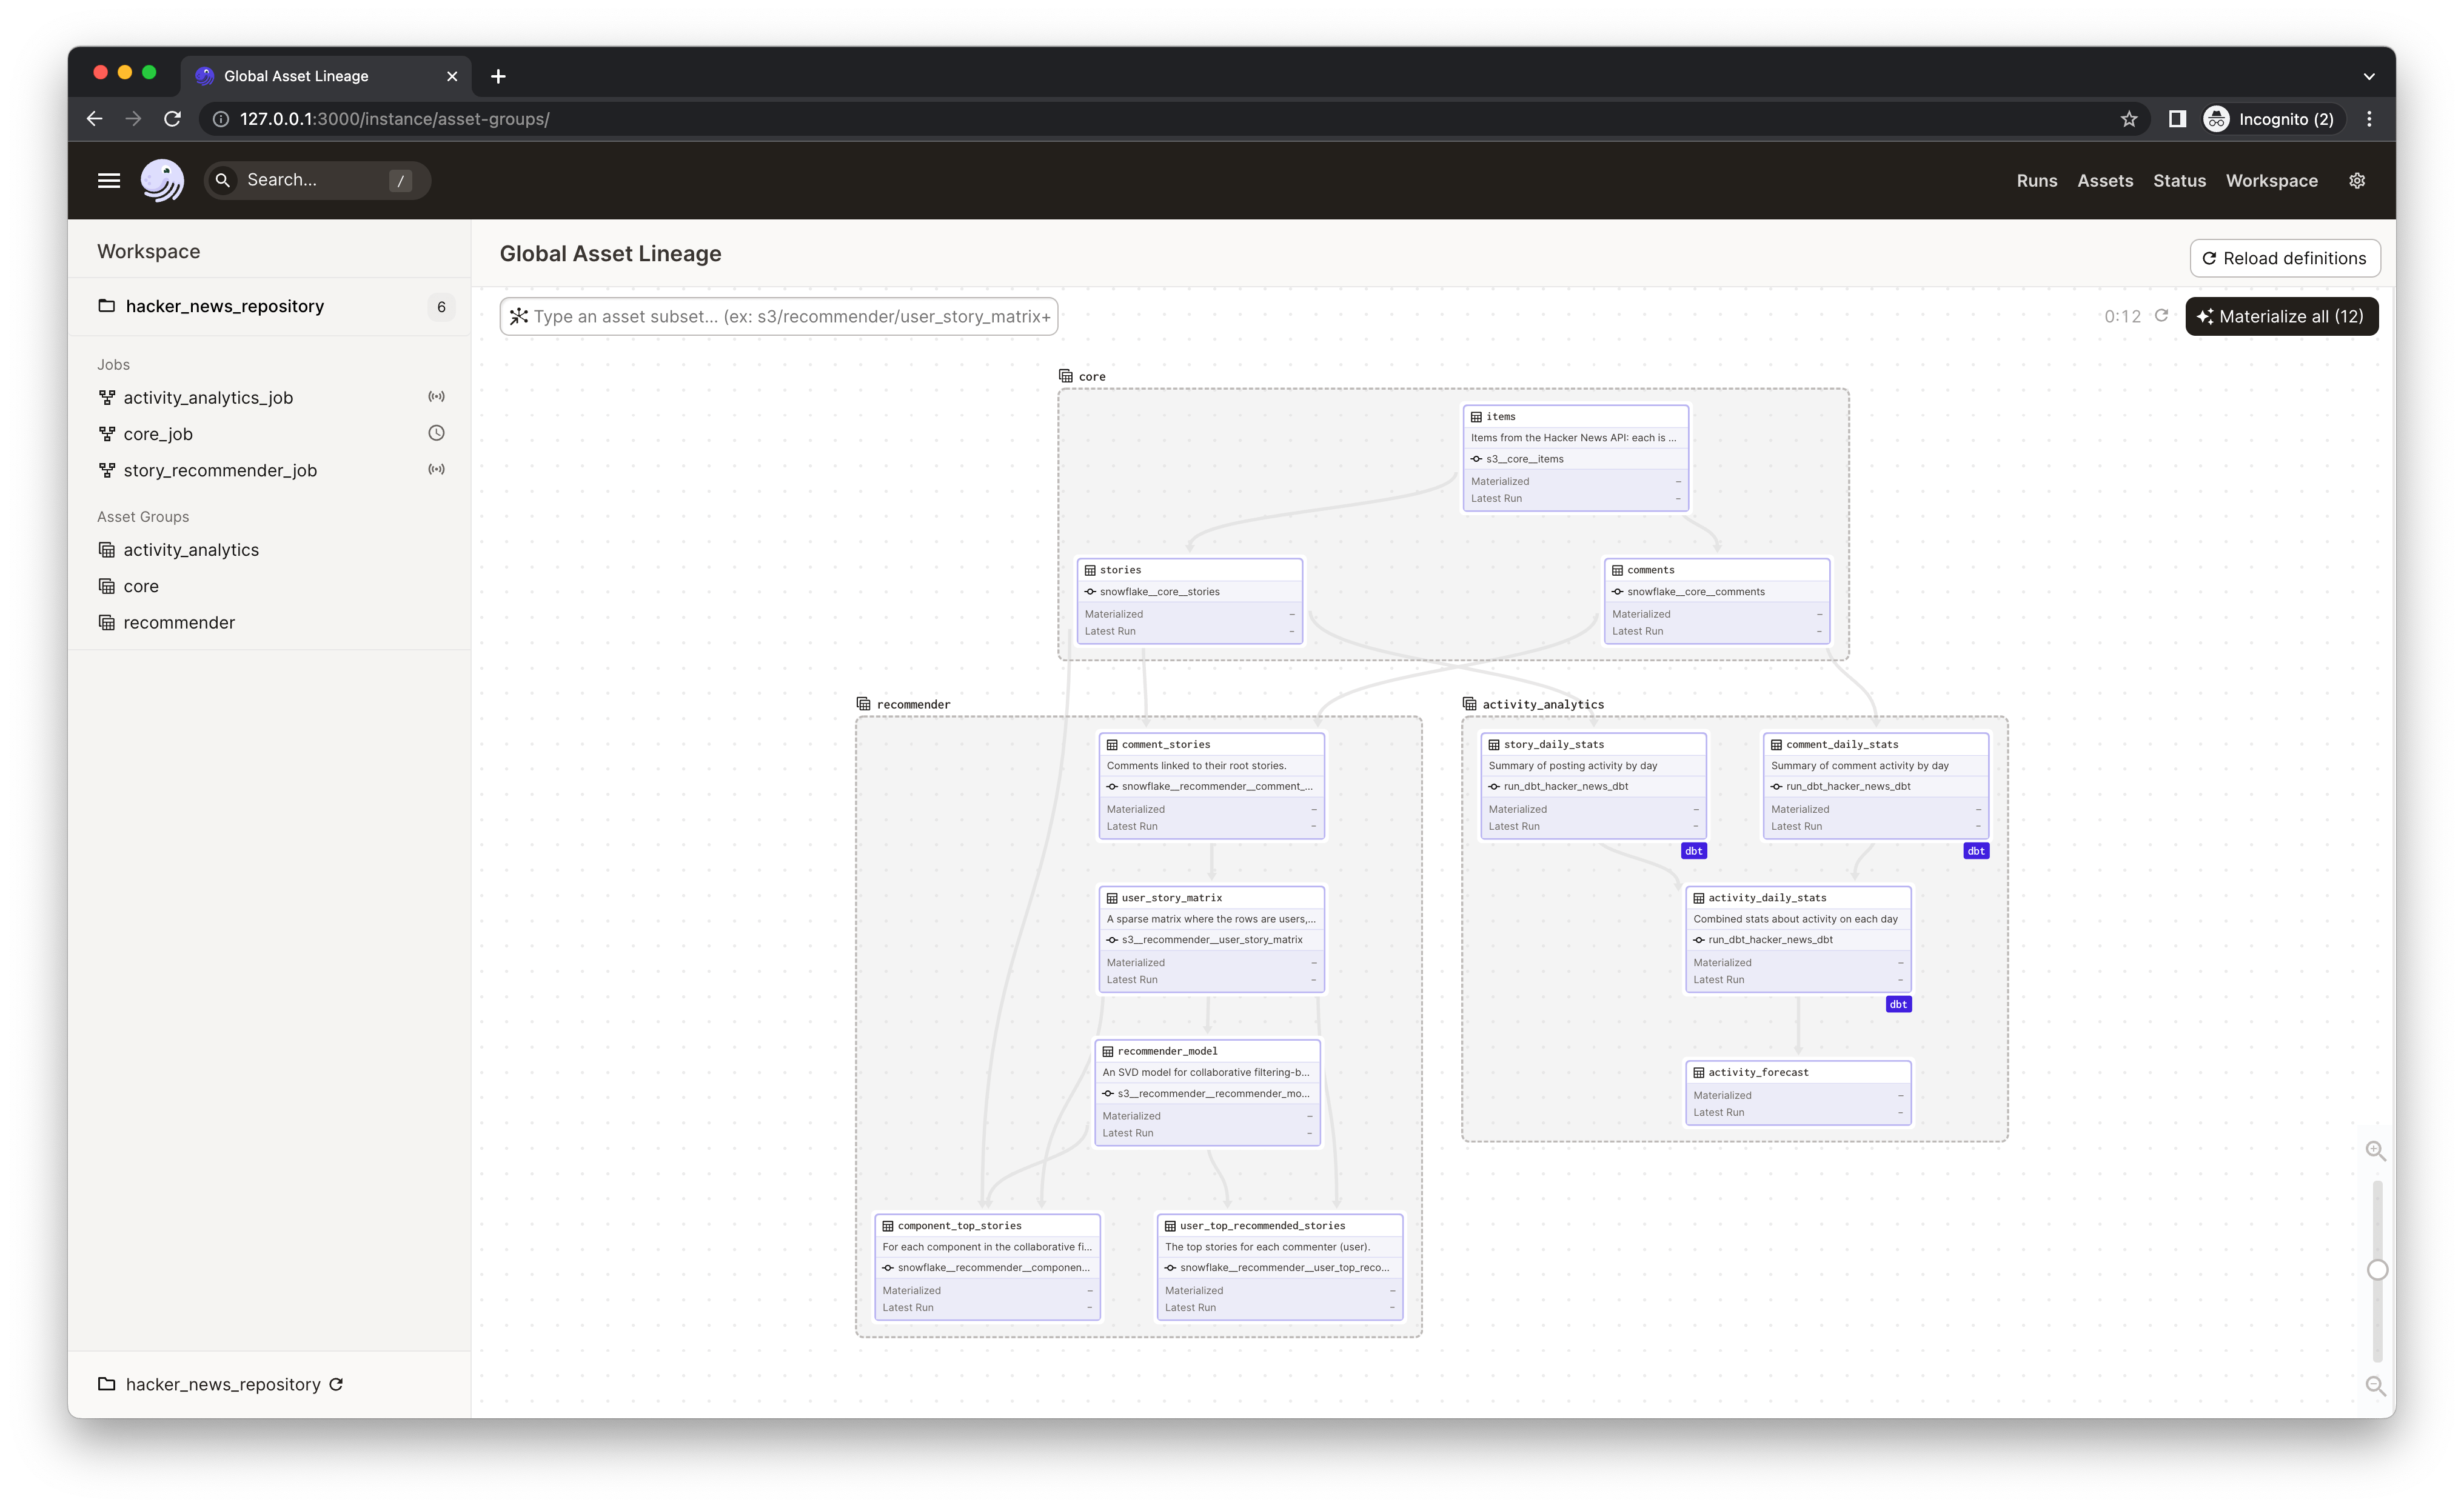
An asset-centric approach also lets you go deeper when tracking down problems – you can follow data dependencies across team and job boundaries to get to the root of a problem.
Dagster’s UI is built to dramatically accelerate debugging
Regardless of if you’re using asset-focused abstractions or not, the root cause of a failure often ends up being an exception that crops up on a particular run. Once you realize that a failure has occurred, Dagster makes it easy to rapidly find the relevant exception, and view any associated logs that might help diagnose the issue.
With assets, if a recent run has failed, this information will be readily shown throughout the UI. Wherever you see this asset, you’ll see a symbol indicating that the computation has failed, along with a direct link to that run. Clicking this lands you in that run’s log viewer, which highlights any failed steps, with specific exceptions easy to locate and view.
Every single run (asset or op) that happens on a given Dagster deployment is also rendered in the runs timeline. Any runs that have failed in a given time period are represented in the UI. Clicking on a failed run lands you back on the log view for that specific run.
These flows make it easy to notice problems when they occur, and to understand the root cause of issues incredibly quickly.
Wrapping up
The right tools can mean the difference between spending 80% of your time fixing problems vs. spending 80% of your time developing data assets. Getting out of the break/fix funk has a huge impact on a data team’s velocity.
We’ve already seen many of Dagster’s users reduce the time they spend troubleshooting issues. And this is just the beginning. Our roadmap has many more improvements aimed at catching issues sooner and getting to the bottom of issues once they’re caught. We’re excited to bring those to you in future releases!


.jpg)
.png)


.png)

