
Buy Dagster with the Snowflake commitment you already have.
Snowflake can tell you which queries ran and how many credits they burned, and attribute those credits by query, warehouse, user and query tag. Connecting that cost data to orchestrator assets, downstream table consumers and freshness shows whether the most expensive table is also the one that keeps arriving late. That context lives in the orchestrator, if it lives anywhere.
In Dagster, every Snowflake table you build or declare is an asset in one graph, next to the ingestion that feeds it, the dbt models that transform it and the Python and ML assets that read from it. Dagster Insights puts numbers on that graph: Snowflake credits and query runtime per asset, alongside failure counts, freshness pass rates and check success rates. Read together, they show you where to spend your time. An expensive asset that is rarely fresh is a candidate for an incremental build or a smaller warehouse. A cheap asset that fails often needs a check on its inputs upstream. And before you change a table’s SQL, the graph shows which downstream assets will rebuild.
Dagster is now on Snowflake Marketplace, and eligible Snowflake customers can pay for it from their capacity commitment, with billing through their Snowflake account.
“Customers want to understand not just how much they’re spending on data, but which pipelines are driving that spend. Dagster Insights connects Snowflake usage to the assets and jobs behind it, while Snowflake Marketplace gives eligible customers a familiar way to buy Dagster and apply qualifying spend to their Snowflake commitment.”
Prasanna Krishnan, Head of Horizon Catalog and Collaboration, Snowflake
Stop a bad load before it reaches the dashboard
Say yesterday’s orders never loaded into Snowflake, so the revenue dashboard’s month-to-date total comes in a day short without any indication. In Dagster, the table behind it is an asset, and its page shows the code that builds it, run history and dependencies.
From the scheduler’s side, that run succeeded: the SQL executed and returned. What it can’t tell you is whether the table is right, and that’s the job of an asset check. In this example, daily_revenue aggregates raw orders in Snowflake and revenue_summary is the monthly rollup the dashboard reads. The check is blocking, so if yesterday has no revenue, the run fails and revenue_summary isn’t rebuilt in that run. daily_revenue is already replaced by then, so anything that reads it directly still sees the short table. The dashboard keeps the month-to-date total from the last good run, which is a day behind, and with an alert policy on check failures, your team hears the data is incomplete before anyone reports it.
import dagster as dg
from dagster_snowflake import SnowflakeResource


@dg.asset
def daily_revenue(snowflake: SnowflakeResource) -> None:
    with snowflake.get_connection() as conn:
        conn.cursor().execute(
            """
            create or replace table analytics.daily_revenue as
            select order_date, sum(amount) as revenue
            from raw.orders
            group by order_date
            """
        )


@dg.asset_check(asset=daily_revenue, blocking=True)
def yesterday_has_revenue(snowflake: SnowflakeResource) -> dg.AssetCheckResult:
    with snowflake.get_connection() as conn:
        cursor = conn.cursor()
        cursor.execute(
            """
            select count(*) from analytics.daily_revenue
            where order_date = current_date - 1 and revenue > 0
            """
        )
        (matching_rows,) = cursor.fetchone()
    return dg.AssetCheckResult(passed=matching_rows == 1)


@dg.asset(deps=[daily_revenue])
def revenue_summary(snowflake: SnowflakeResource) -> None:
    with snowflake.get_connection() as conn:
        conn.cursor().execute(
            """
            create or replace table analytics.revenue_summary as
            select date_trunc('month', order_date) as month, sum(revenue) as revenue
            from analytics.daily_revenue
            group by 1
            """
        )


defs = dg.Definitions(
    assets=[daily_revenue, revenue_summary],
    asset_checks=[yesterday_has_revenue],
    resources={
        "snowflake": SnowflakeResource(
            account=dg.EnvVar("SNOWFLAKE_ACCOUNT"),
            user=dg.EnvVar("SNOWFLAKE_USER"),
            private_key_path=dg.EnvVar("SNOWFLAKE_PRIVATE_KEY_PATH"),
            private_key_password=dg.EnvVar("SNOWFLAKE_PRIVATE_KEY_PASSWORD"),
            warehouse="TRANSFORMING",
            database="ANALYTICS",
        )
    },
)
SnowflakeResource here authenticates with an encrypted private key. For assets that return DataFrames, SnowflakePandasIOManager and SnowflakePySparkIOManager write the results to Snowflake tables, and with partitioning configured they replace only the rows for the partition being processed. If you build these tables with dbt, dagster-dbt loads each model as an asset and runs its dbt tests as asset checks. The Dagster + Snowflake integration page and the dagster-snowflake reference cover the rest of the API.
Trace Snowflake spend to the assets behind it
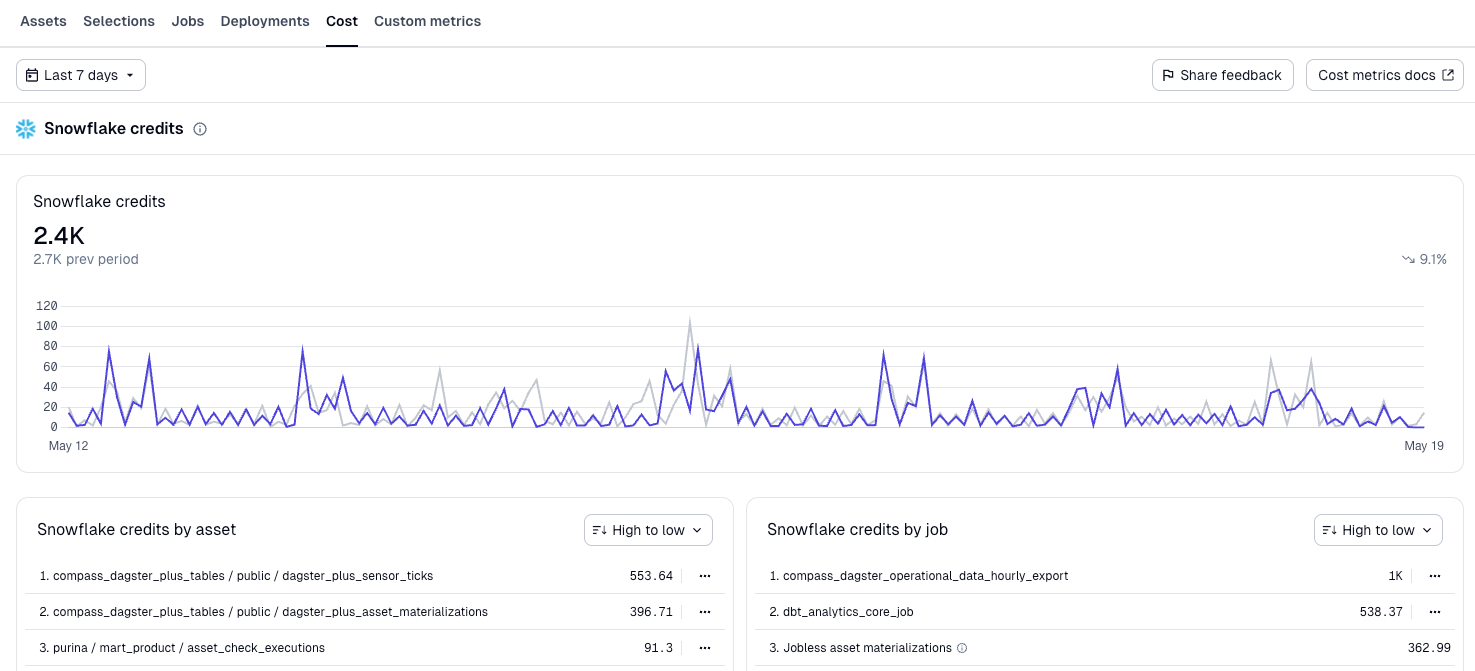
Snowflake cost tracking is part of Dagster Insights on the Pro plan. Insights attributes Snowflake query runtime and billed credits to the assets and jobs that ran the queries, and shows them next to your run history.
Suppose revenue_summary starts using twice as many credits after a change to its SQL. Without attribution, you’d search Snowflake’s query history for the expensive queries and work out which pipeline sent them. In Insights, the Cost tab ranks Snowflake credits by asset and by job and compares them with the previous period, so the asset and the day its cost changed are on one screen.
The example above connects to Snowflake but doesn’t report usage to Insights. To turn on attribution:
- Replace
SnowflakeResourcewithInsightsSnowflakeResourcefromdagster_cloud.dagster_insights. It takes the same configuration. - Add the asset and schedule from
create_snowflake_insights_asset_and_schedule, which ingest the previous hour’s usage from Snowflake. Add them in one code location per deployment. - Grant the
SNOWFLAKE.GOVERNANCE_VIEWERdatabase role to the Snowflake role. ASELECTgrant onquery_historyalone isn’t accepted. The credit figure comes fromQUERY_ATTRIBUTION_HISTORY.CREDITS_ATTRIBUTED_COMPUTE, which excludes warehouse idle time, serverless features and storage.
For dbt projects that target Snowflake, chain .stream().with_insights() onto your dbt.cli([...], context=context) calls if you use @dbt_assets, or add insights to include_metadata if you use DbtProjectComponent. In both cases, add the query comment from the setup guide to dbt_project.yml.
In Dagster Insights, usage data can take up to 24 hours to appear and is kept for 120 days. The Insights Snowflake guide covers the full setup.
Choose where your code runs
The listing supports both Dagster deployment models. For a Snowflake team, the deciding question is usually governance: who holds your Snowflake credentials, and which network your queries come from.
On Serverless, Dagster runs your code on managed infrastructure, so your team doesn’t provision or maintain compute. The trade-off is access. Serverless needs your code, your secrets and access to your data to run your pipelines, so your Snowflake credentials are stored in Dagster and your queries reach Snowflake from Dagster’s network. If your account has a network policy, you allow the Serverless IP addresses. If you handle regulated data, watch the default I/O manager, which stores asset outputs in Dagster-managed storage. The SnowflakeResource and Snowflake I/O managers in this post write to your own Snowflake account instead.
On Hybrid, Dagster hosts the control plane and an agent runs your code on your own compute using Kubernetes, Amazon ECS or Docker. Code, credentials and data stay in your environment, and Snowflake queries come from your network. The agent only makes outbound connections to Dagster, so you don’t open any ingress, and on AWS you can keep that traffic on PrivateLink. What does reach Dagster is metadata: asset names, lineage, run status, check results and any metadata you attach, such as row counts. Raw compute logs are uploaded by default, and you can turn that off in the agent settings. In exchange, your team operates the agent and the compute behind it.
If your Snowflake account holds PII or other regulated data, or your security team reviews every change to a network policy, I’d start on Hybrid. Otherwise Serverless gets you to a first run faster, and you can move to Hybrid later.
Pay through Snowflake Marketplace
If your company has a Snowflake capacity commitment, the Marketplace Capacity Drawdown program lets eligible Marketplace purchases count toward it. The Dagster listing is eligible, so Dagster can be paid for with spend you’ve already committed to Snowflake instead of a new budget line. Whether your purchase counts depends on the terms of your Snowflake contract, so confirm with your Snowflake account team before you buy.
The listing doesn’t have a public price. You agree on pricing with our sales team, we send a private offer to your Snowflake account with those terms, and you accept it through the listing. Dagster then appears on your Snowflake invoice, next to your warehouse usage. The listing covers both Serverless and Hybrid, so you can make the deployment choice above after you buy.
To get started, open the Dagster listing and select Get.
Have feedback or questions? Start a discussion in Slack or Github.
Interested in working with us? View our open roles.
Want more content like this? Follow us on LinkedIn.