Dagster+ helps you monitor the freshness, quality, and schema of your data.
The job of a data orchestrator is to help you produce and maintain the data assets that your organization depends on. Whether those assets are tables, machine learning models, or reports, in order to be useful, they need to be trustworthy and reliable. That is, they need to consistently contain up-to-date and high-quality data. But bugs are inevitable, and pipeline developers don’t control the data that enters their pipelines. So the only realistic way to achieve trustworthy data is with monitoring and issue detection, so that issues can be addressed before they affect downstream consumers.
Most data teams struggle with data reliability, because they don’t have robust monitoring over their data. Workflow-oriented orchestrators like Airflow will report if a data pipeline hits an error during execution, but don’t offer visibility into the quality, completeness, or freshness of the data they’re updating.
Teams that adopt standalone data reliability tools often end up abandoning them, because they’re difficult to fit into practices for operating data. Data engineers end up needing to visit both their orchestrator and their reliability tool to understand the health of their data pipeline. And if they want to trace data reliability alerts to the DAGs that generated the data, they need to try to integrate their data reliability tool with their orchestrator. This usually means contending with query-tagging schemes that are fragile to configure and maintain.
Data Reliability and Dagster
At Dagster Labs, we believe orchestration and data reliability go hand in hand. Dagster’s asset-oriented approach to data orchestration enables Dagster+ to offer a full set of data reliability features. These help you monitor the freshness of your data, the quality of your data, and changes to the schema of your data.
Dagster helps monitor both the source data that feeds your pipelines and the data produced by your pipelines. Monitoring source data helps you find out early if your pipeline is going to run on stale, bad, or unexpected data. Monitoring output data helps you ensure that the final product is on time and high quality.
Dagster’s Data Reliability Stack
Dagster’s data reliability stack is a layered suite of functionality: with the base in Dagster core, and enterprise additions in Dagster+. At the center is a Dagster core feature called Asset Checks. An asset check is responsible for determining whether a data asset meets some property, such as whether it contains the expected set of columns, contains no duplicate records, or is sufficiently fresh.
Asset checks can be executed in line with data pipelines, or scheduled to execute independently. Optionally, Dagster can halt your data pipeline when an asset check fails, to avoid propagating bad data. Asset checks were introduced as an experimental feature last year, and we’ve marked them as generally available in Dagster’s recent 1.7 release.
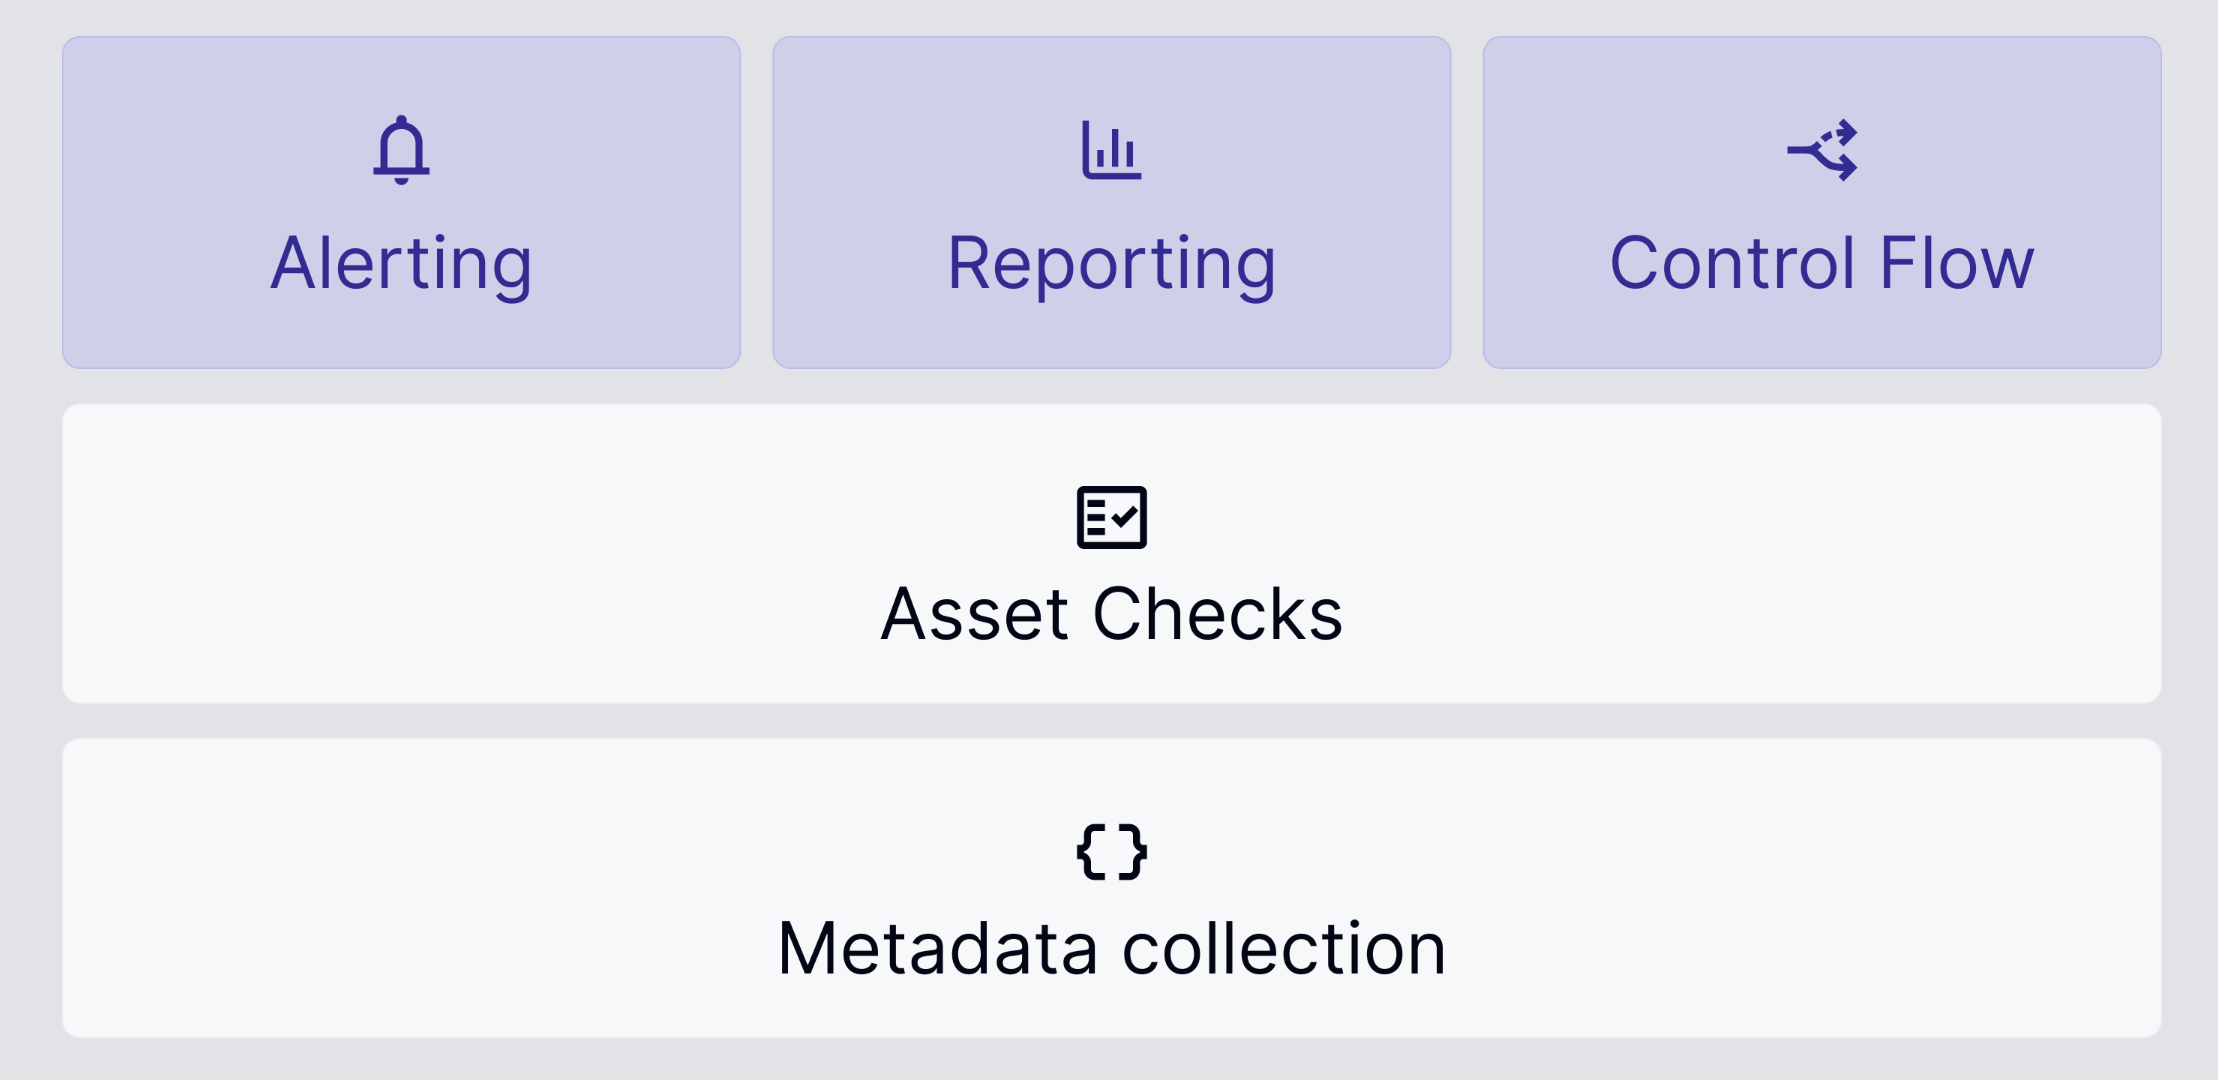
Asset checks sit on top of Dagster’s rich metadata system, which can be used to store any metadata, from row counts to timestamps to table column schema.
With Dagster+, asset checks can be used as a basis for alerting and reporting. When an asset check fails, Dagster+ can notify the asset’s owner. And Dagster+ Insights allows understanding the results of asset checks in aggregate - for example, did we violate our asset freshness guarantees more times this week than last week?
Because Dagster makes it easy to see the checks that are defined for any asset, asset checks are also helpful for describing and enforcing data contracts. For organizations following data mesh approaches, teams can use asset checks to communicate invariants about the data products that they expose to the rest of the organization.
Asset checks are already widely used in the Dagster community for enforcing data quality, often by wrapping dbt tests. In our latest release, we’ve expanded the utility of asset checks beyond data quality to also cover data freshness and data schema changes.
Monitoring Data Freshness
Monitoring data freshness means tracking when data assets are updated and identifying when one of them is overdue for an update.
For source data, freshness monitoring helps you find out early if your pipeline is going to run on stale data. For data produced by your pipelines, freshness monitoring is a final backstop that helps you detect any delay in your pipelines’ completion.
Dagster helps both with tracking when data is updated and with detecting when updates are overdue.

Because Dagster pipelines are defined in terms of data assets, Dagster knows directly when data assets are updated. Additionally, its asset-oriented metadata system makes it straightforward to observe & collect metadata from the data warehouse about when source data is updated.
Once you’re tracking data updates, you can set up freshness checks to identify when your data is overdue. Freshness checks can either be based on rules or based on anomaly detection.
For rule-based freshness checks, you set limits on how out-of-date it’s acceptable for your asset to be, for example requiring an update every 6 hours.
For anomaly detection freshness checks, Dagster+ looks at the history of updates to your asset to determine whether recent behavior is consistent. This is especially useful when you have many assets to monitor and don’t want to figure out the specific rule that applies to each one.
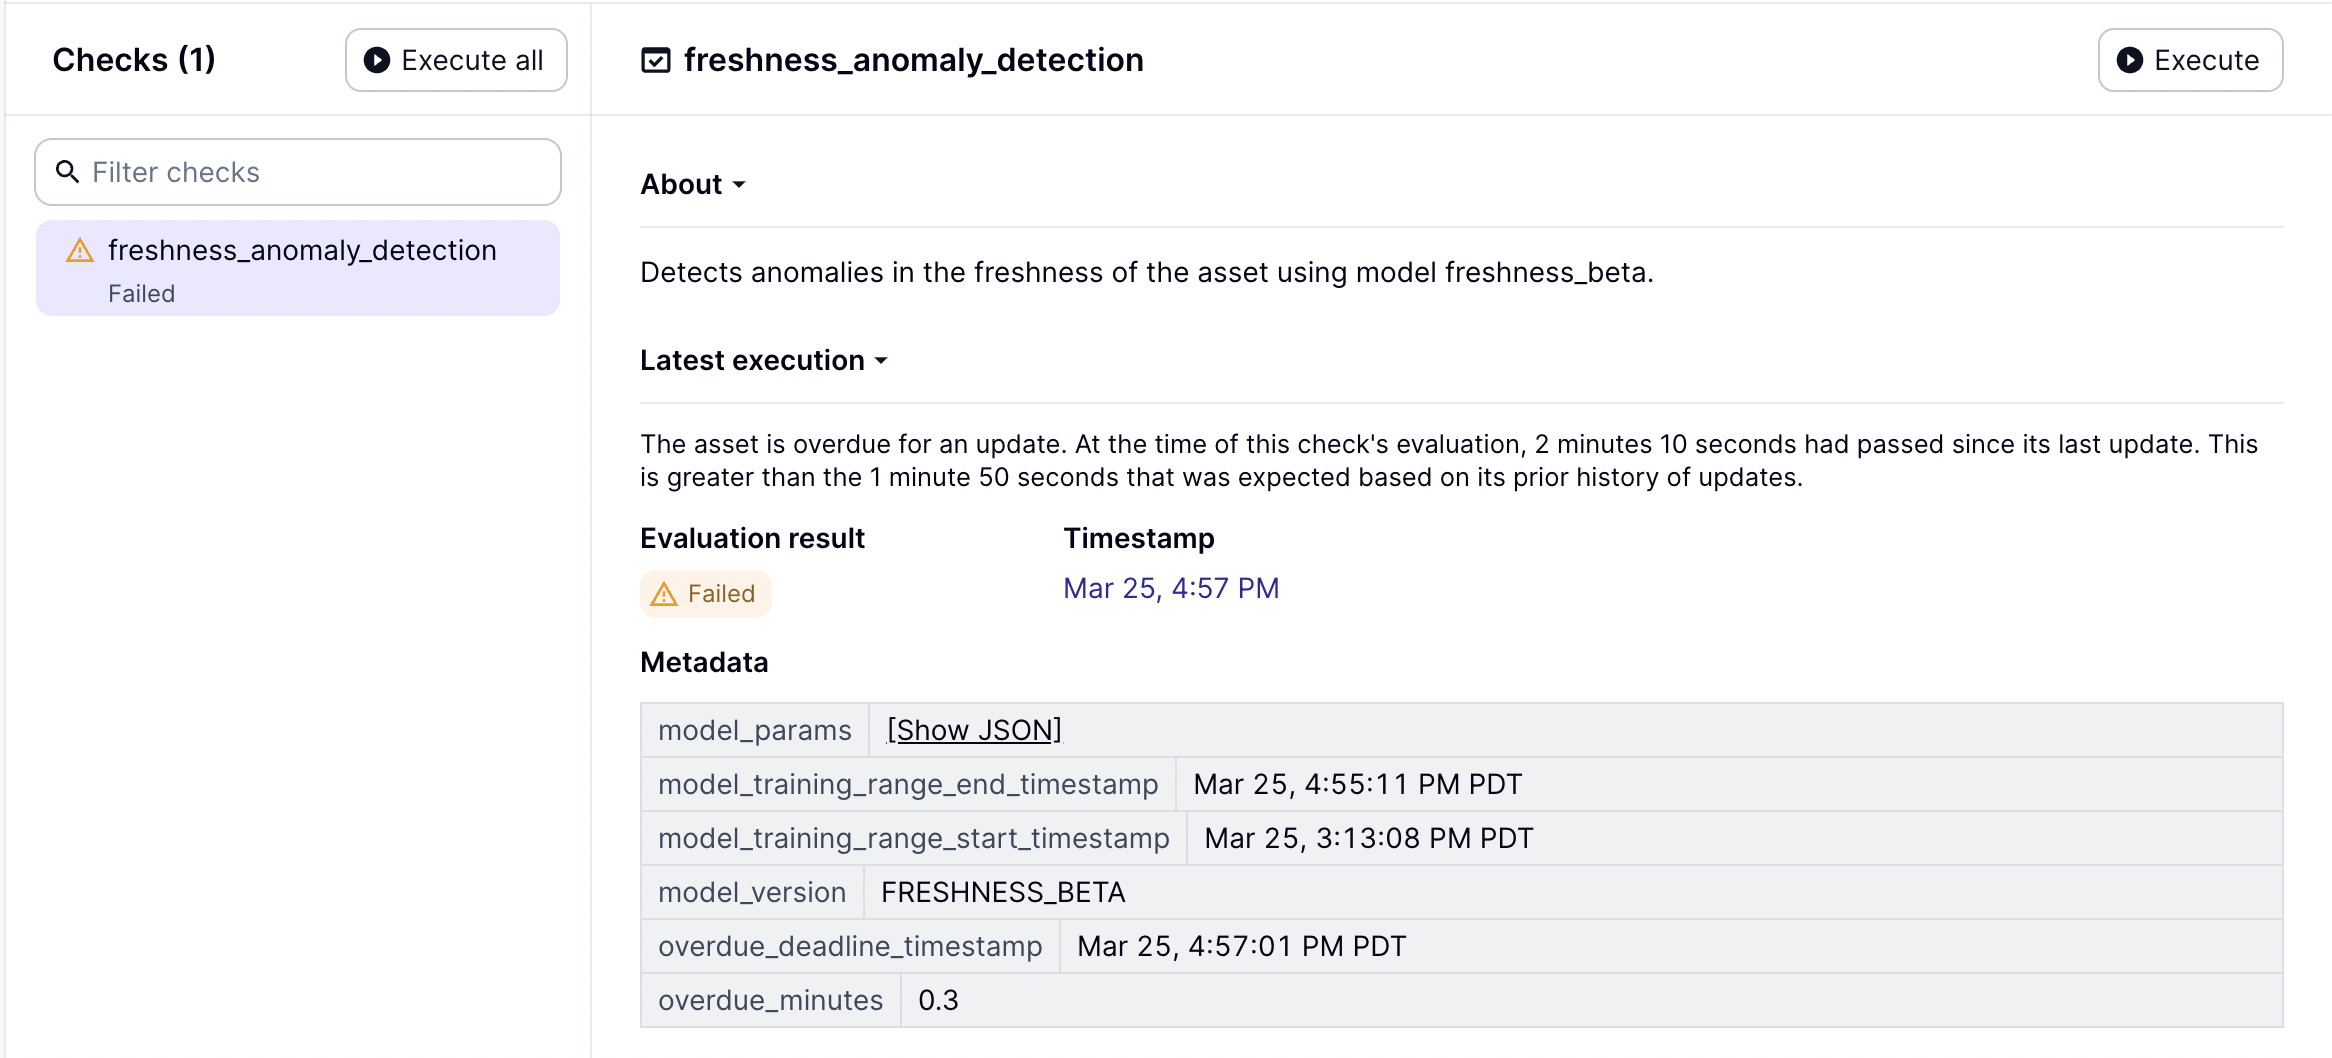
As with all asset checks, you can get alerts when freshness checks fail, so you can be notified about freshness issues before they affect your stakeholders.
Data Quality
Freshness is an important aspect of data reliability, but not all fresh data is high quality data. Dagster also helps catch data quality issues and communicate data contracts.
Dagster’s asset-oriented metadata system makes it easy to record metrics about your data, like number of rows, number of null values in each column, etc., as well as to chart how they change over time.
Dagster asset checks then allow you to identify when your data doesn’t look like you expect it to. As mentioned above, you can optionally halt your pipeline when an asset check fails. And, with Dagster+, you can send alerts when asset checks fail and look at reports of their aggregate performance.
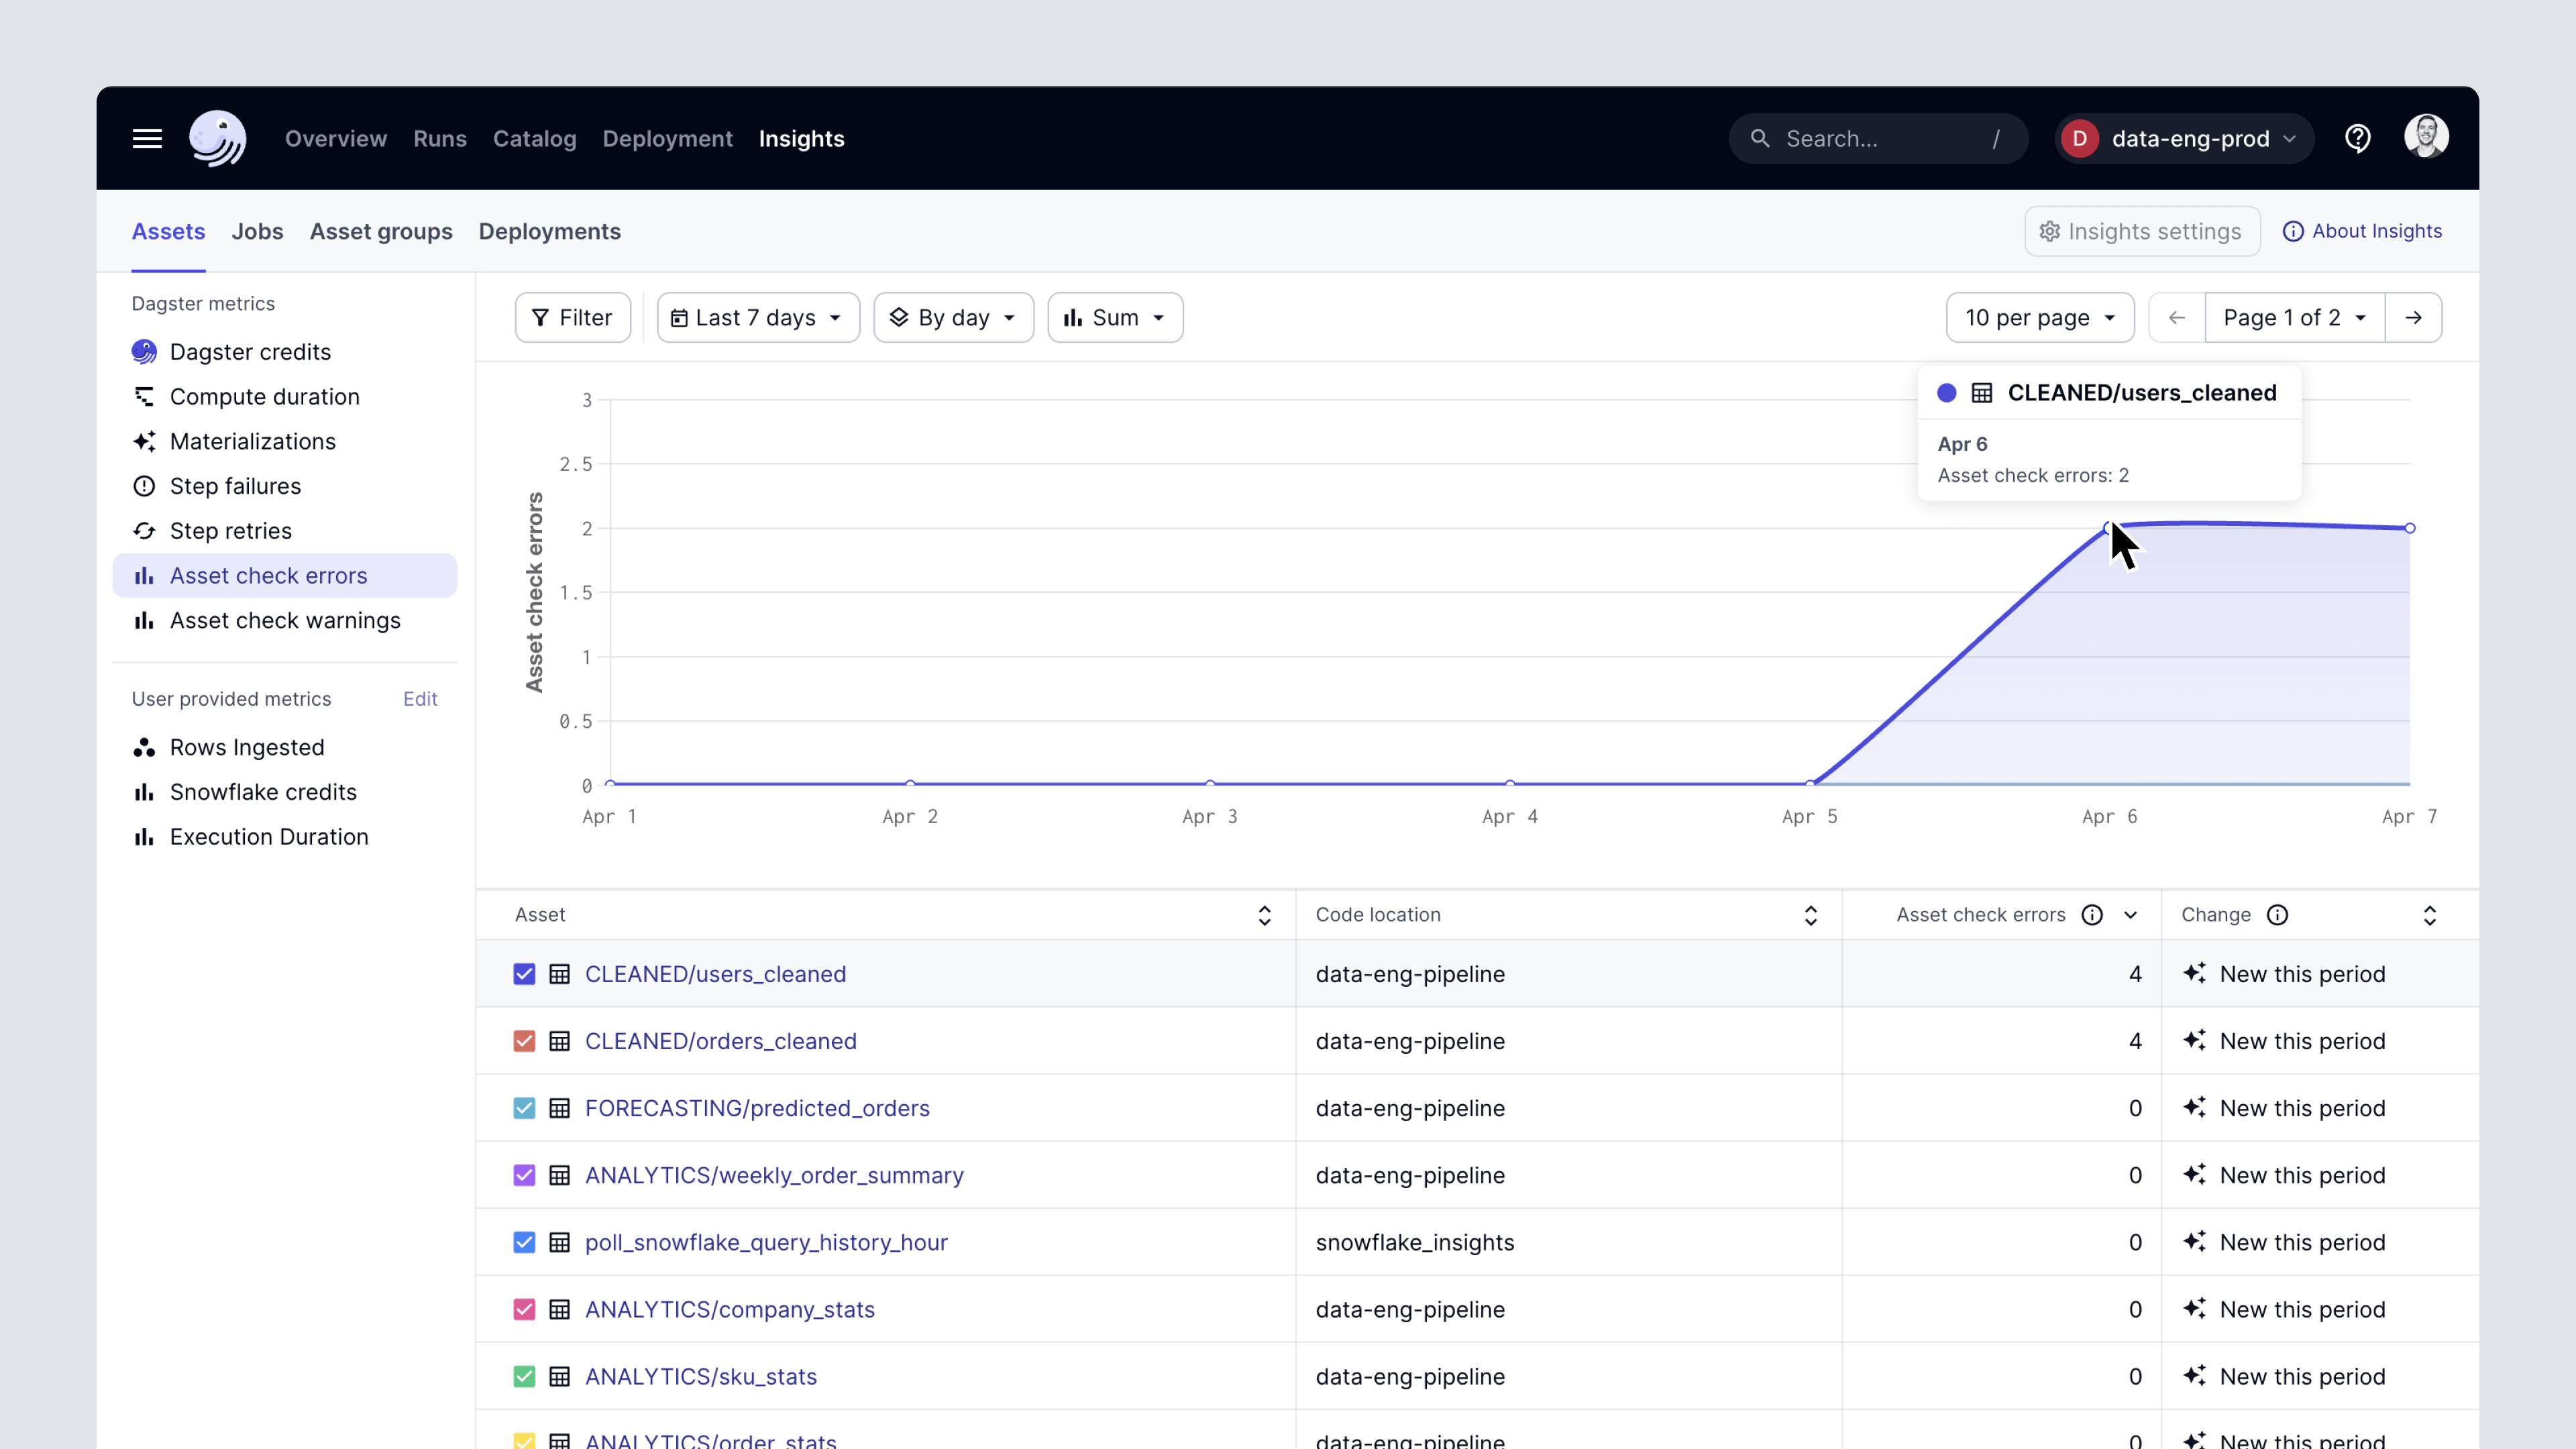
Asset checks are supremely flexible. You can implement any data quality logic in Python. You can also use Dagster’s dbt integration to automatically pull in all your dbt tests as Dagster asset checks. Asset checks have access to Dagster’s event log, so it’s straightforward to write asset checks that compare an asset’s attributes to earlier metadata, for example to see if the number of rows has unexpectedly tanked.
Schema Changes
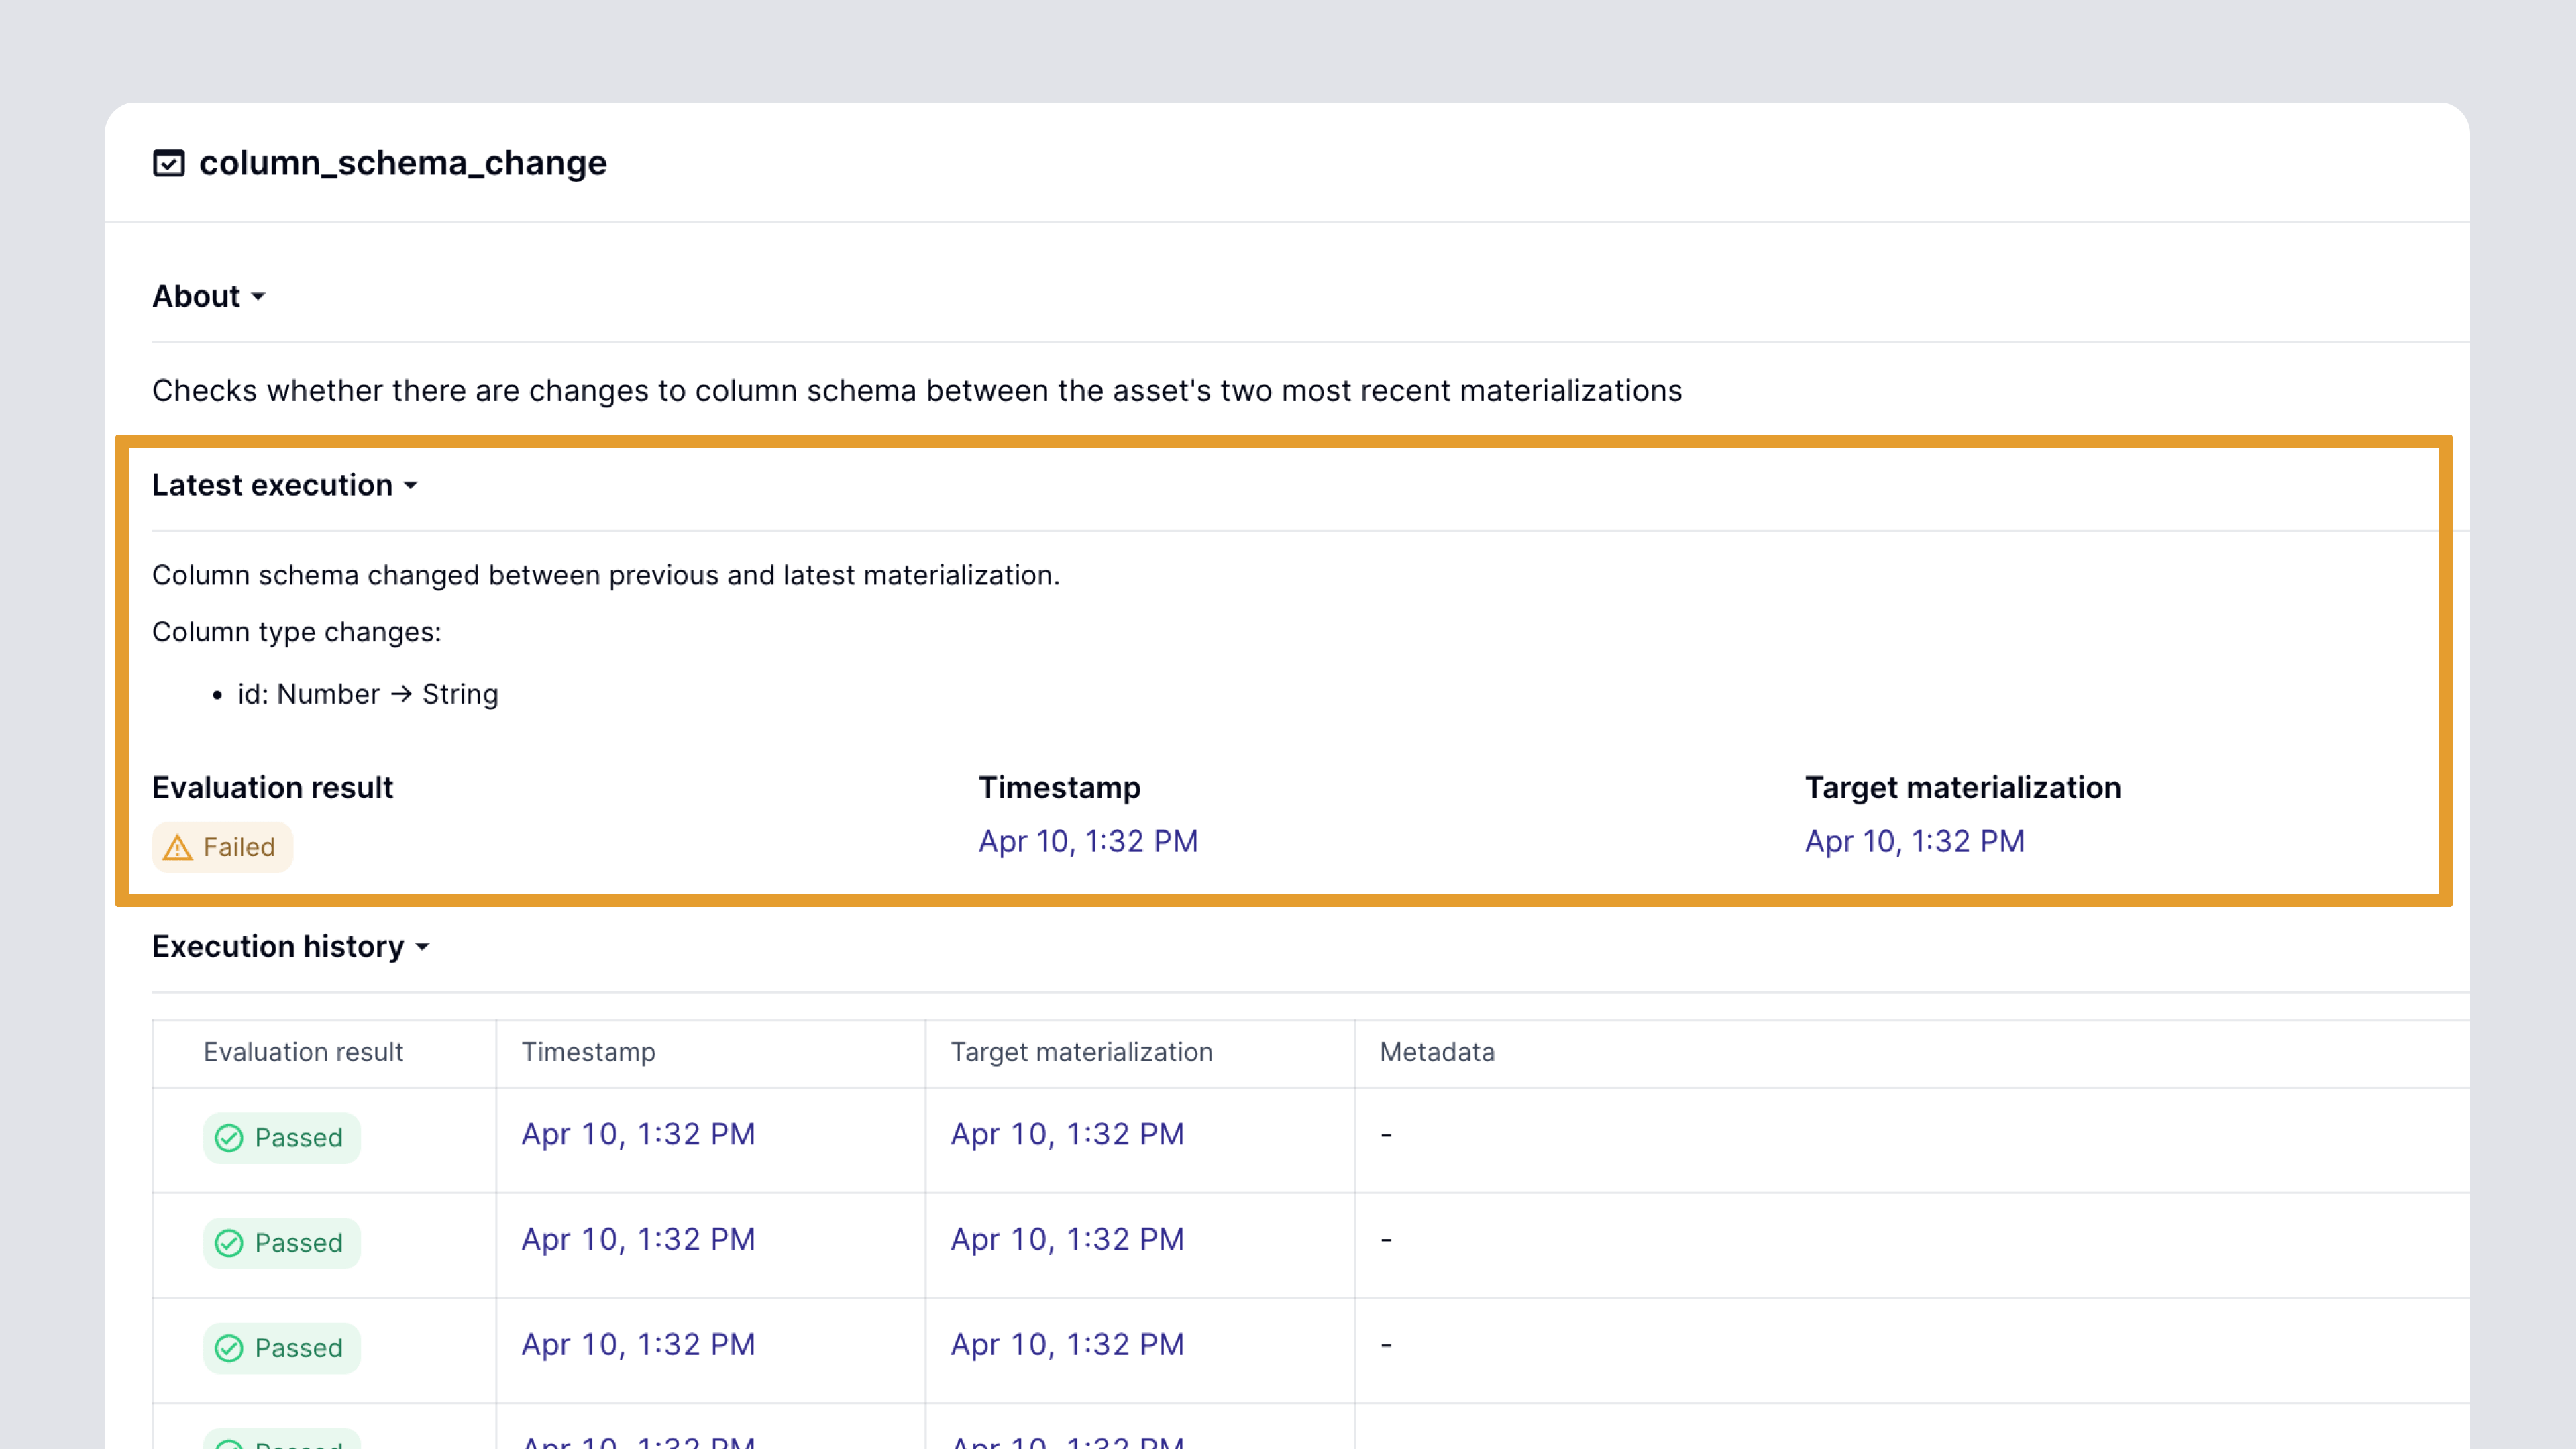
On top of catching data freshness and quality issues, Dagster can help catch changes in data schema. If a column is removed from a table, or if its type changes, then any software or dashboard that depends on that table is liable to be broken. Sometimes, changes to data schema are intentional. Other times, a change to a table schema is an accidental result of a seemingly innocuous change to the SQL query that generates it. Either way, it’s important for pipeline developers and their stakeholders to be able to learn about these changes.
Again, Dagster’s reliability stack helps out with this. Dagster’s metadata system can store table column schemas. With Dagster’s dbt integration, these are actually captured automatically. Then, Dagster offers built-in asset checks for catching changes to column schema. And like all asset checks, they can be used as a basis for alerting, reporting, and control flow.
The Single Pane of Glass for Data Reliability
Together, all these capabilities allow Dagster to function as a single pane of glass for the health of your data assets and pipelines. Dagster’s upcoming asset health dashboard manifests this by integrating pipeline failures, data quality, and freshness into a single view.
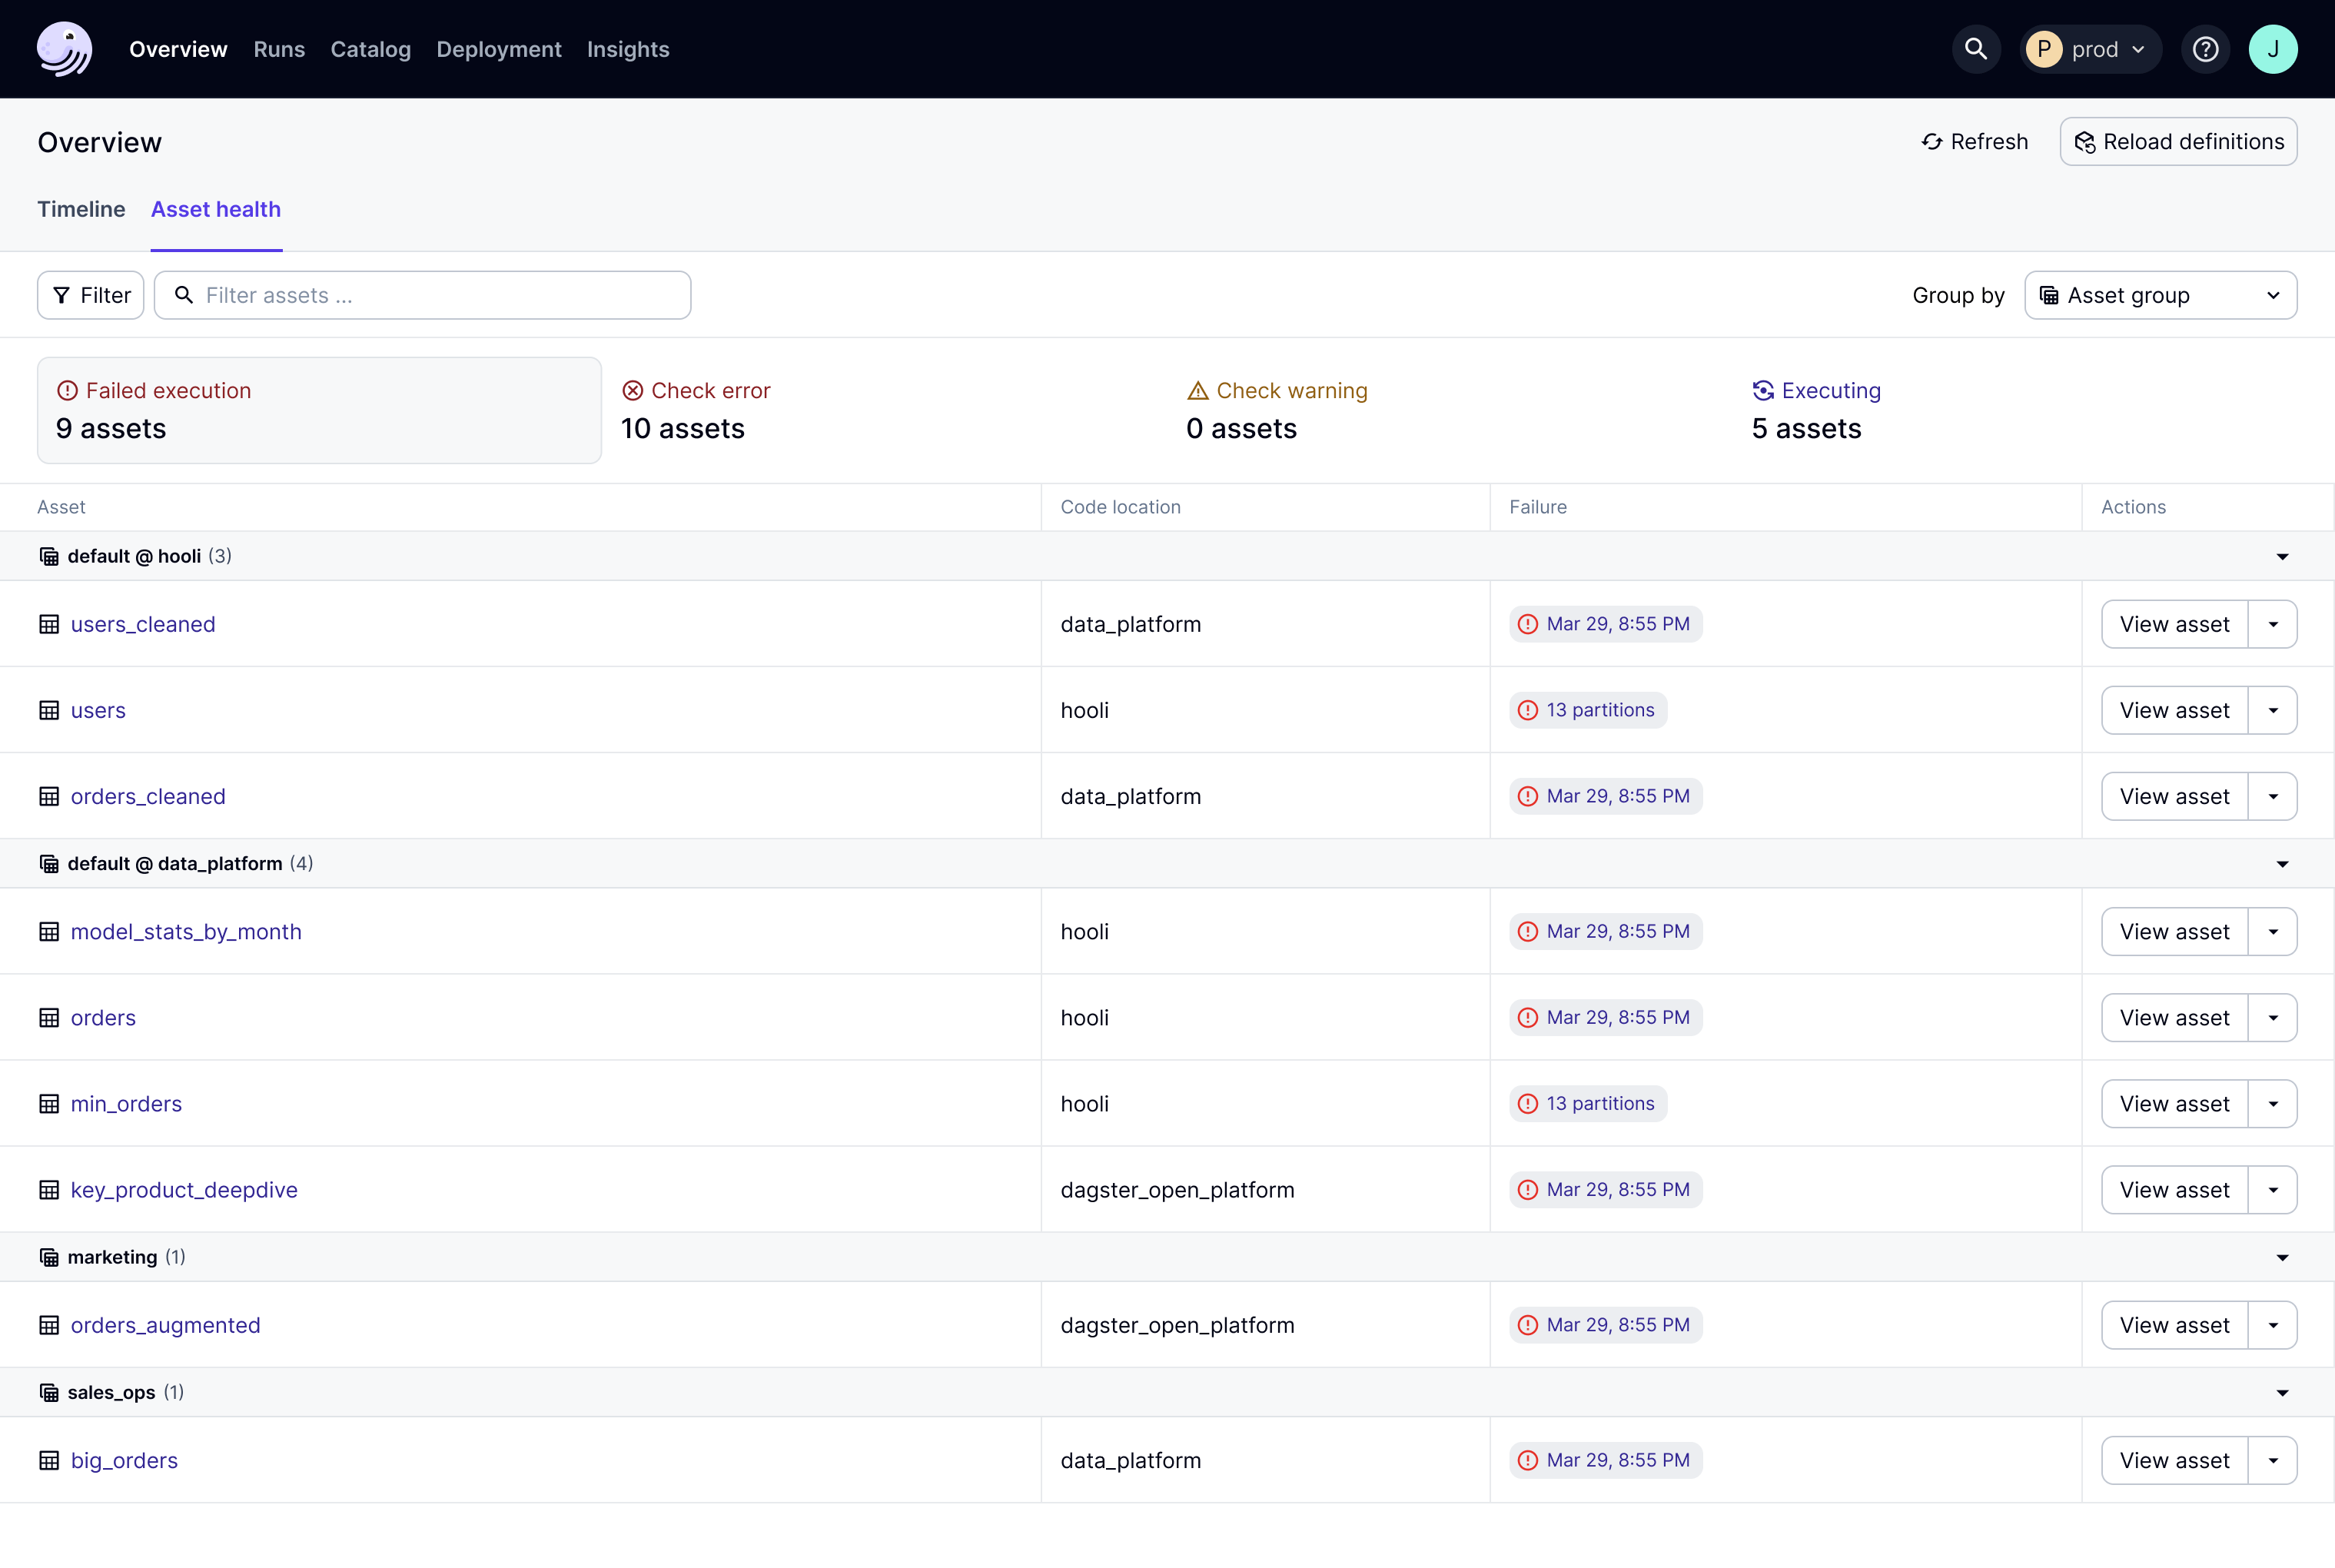
By handling data reliability in the same system that you use to develop and operate data pipelines, it becomes a first class concern, instead of something tacked on at the end. Data reliability is one of the most important operational capabilities of a data platform, and the orchestrator is the data platform’s natural operational system of record. Dagster’s data reliability features allow you to standardize, across your entire data platform, the monitoring that you need to deliver trustworthy data to your stakeholders.


.jpg)
.png)
.jpg)

.png)
