


Step-by-step guide to debugging Dagster code directly in Docker, bridging the gap between development and deployment.
Debugging and testing code effectively is necessary across the whole software lifecycle. Dagster provides extensive support for testing and debugging code.
For interactive debugging, a common approach is to run dagster dev on your host machine using Visual Studio Code (or other editors/IDEs). This approach lets you quickly connect your development environment to the code, set breakpoints, and use the debug console.
However, this solution may fall short in certain scenarios—particularly if you manage Dagster deployments through containerization technologies like Docker. Running dagster dev locally can become cumbersome because:
- You need to install all the necessary dependencies on your local machine.
- You may have to set up and synchronize your environment configurations between local and deployment environments.
- You may run into issues stemming from differences between local and deployment setups that surface only after deployment
In this blog post, I’ll walk you through setting up interactive debugging directly within Docker and Docker Compose–without modifying your existing setup.
Initial Setup
We'll set up a basic Dagster deployment using Docker and Docker Compose. The Docker Compose configuration will spin up the following services:
- PostgreSQL database for Dagster
- Dagster webserver
- Dagster daemon
- Dagster code location
Let's review the Dockerfiles for each service: .docker/webserver.Dockerfile
FROM python:3.12-slim as base

RUN pip install \
  dagster \
  dagster-graphql \
  dagster-webserver \
  dagster-postgres

ENV DAGSTER_HOME=/opt/dagster/dagster_home/

RUN mkdir -p $DAGSTER_HOME
COPY workspace.yaml dagster.yaml $DAGSTER_HOME

WORKDIR $DAGSTER_HOME

ENTRYPOINT [ "dagster-webserver", "-h", "0.0.0.0", "-p", "3000", "-w", "workspace.yaml"]
.docker/daemon.Dockerfile
# Same as .docker/webserver.Dockerfile
ENTRYPOINT [ "dagster-daemon", "run"]
.docker/code-location.Dockerfile
FROM python:3.12-slim as base

RUN pip install \
   dagster \
   dagster-postgres

ENV DAGSTER_HOME=/opt/dagster/dagster_home

RUN mkdir -p $DAGSTER_HOME

COPY dagster.yaml $DAGSTER_HOME

WORKDIR /opt/dagster/app

## Install only the dependencies, then the package. If the source changes the dependencies layer is not rebuilt
COPY src /opt/dagster/app

# Run dagster gRPC server on port 4000
EXPOSE 4000
CMD ["dagster", "code-server", "start", "-h", "0.0.0.0", "-p", "4000", "-m", "defs"]
Next, we need a Docker Compose file to orchestrate the containers:
services:
 db:
   image: postgres:16.4
   environment:
     POSTGRES_USER: user
     POSTGRES_PASSWORD: password
     POSTGRES_DB: postgres
   ports:
     - "5432:5432"
   volumes:
     - db_data:/var/lib/postgresql/data

 webserver:
   build:
     context: .
     dockerfile: .docker/webserver.Dockerfile
   ports:
     - "3000:3000"
   env_file:
     - .env

 code_location:
   build:
     context: .
     dockerfile: .docker/code-location.Dockerfile
   env_file:
     - .env

 daemon:
   build:
     context: .
     dockerfile: .docker/daemon.Dockerfile
   env_file:
     - .env

volumes:
 db_data:
At this point, we should be able to run docker-compose up and have our Dagster deployment up and running!
Setting Up Interactive Debugging
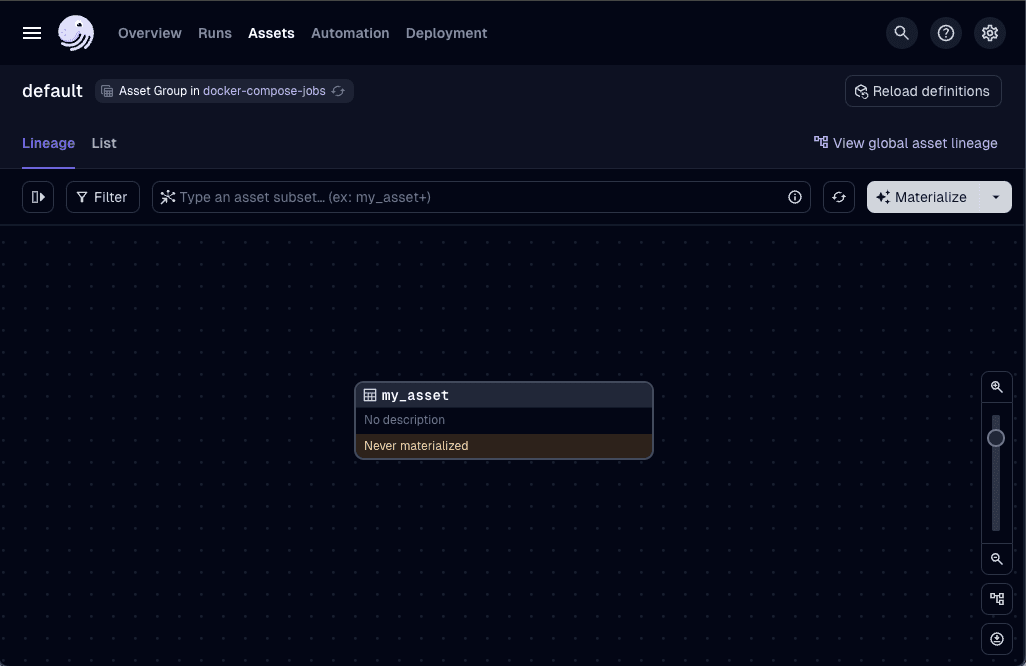
Now we can materialize our assets and start working with Dagster.
So, how do you set up interactive debugging?
Turns out it's quite simple: we can leverage the debugpy library to set up a remote debugging session in our code location container, and leverage the docker-compose to override the entrypoint and start the debugging session.
Let's start by adding the debugpy library to our code location Dockerfile:
...
WORKDIR /opt/dagster/app
RUN pip install debugpy
...
Next, modify the entrypoint of the code location container to run the dagster code-server through debugpy and expose the port 5678 for the debugger:
 code_location:
   build:
     context: .
     dockerfile: .docker/code-location.Dockerfile
   env_file:
     - .env
   ports:
     - "5678:5678"
   entrypoint: python
   command:
     - -m
     - debugpy
     - --listen
     - 0.0.0.0:5678
     - -m
     - dagster
     - code-server
     - start
     - -h
     - 0.0.0.0
     - -p
     - "4000"
     - -m
     - defs
Lastly, set up the launch configuration in VSCode to connect to the remote debugger (similar configurations can be made for other editors/IDEs). Add this configuration to the .vscode/launch.json file:
{
   "version": "0.2.0",
   "configurations": [
       {
           "name": "Python: Remote Attach",
           "type": "python",
           "request": "attach",
           "connect": {
               "host": "localhost",
               "port": 5678
           },
        "justMyCode": false,
           "pathMappings": [
               {
                   "localRoot": "${workspaceFolder}/src",
                   "remoteRoot": "/opt/dagster/app"
               },
               {
                   "localRoot": "${workspaceFolder}/venv",
                   "remoteRoot": "/usr/local
               }
           ]
       }
   ]
}
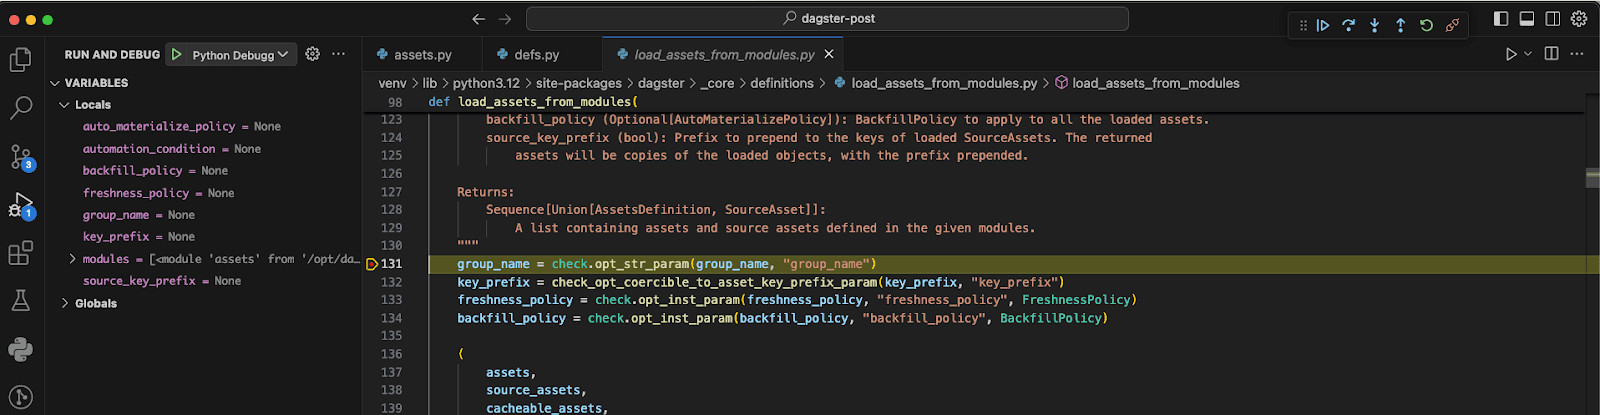
The first path mapping maps our code to its position in the Docker container. This allows us to debug our assets, schedules, and the rest of the code that we write. The second path mapping is used to map Dagster’s source code from our Python environment to that on the Docker container, enabling us to debug Dagster’s internals as well.
The exact mappings will change depending on how you install Python libraries in your development environments and on the Docker container.
Now you can start the debugging session in VSCode and connect to the remote debugger running in the code location container.
Debug Everything
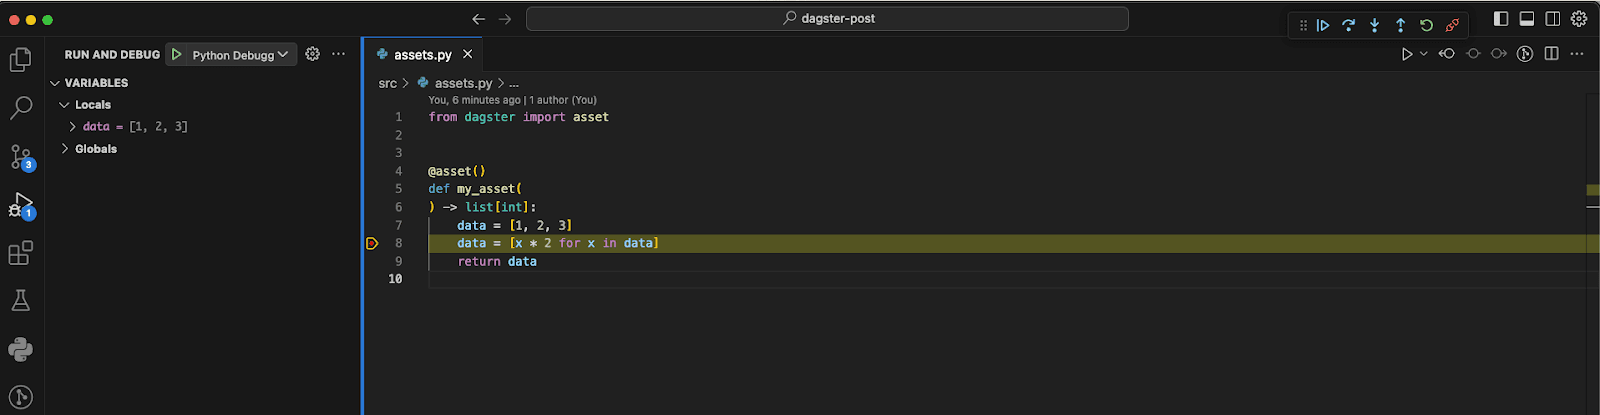
To interactively debug an asset, simply run the launch configuration in VSCode and set a breakpoint in the asset’s code. Then, trigger the asset from the Dagster web UI. The debugger will halt execution at your breakpoint, allowing you to inspect the code’s state and variables.
We can even step into the Dagster code.
Wrapping Up
Interactive debugging is essential in Software & Data Engineering. It enables a smoother development experience and allows you to quickly find and fix bugs. When setting up debugging we want the development environment to be as close as possible to our production environments, so we can be confident that the code we write will also work when promoted and deployed remotely. When working with Dagster with a containerized approach, we can easily set up interactive debugging using debugpy to debug our code and even Dagster’s. To see the full project of how this is configured you can check out this repository


.jpg)
.png)


.png)

