

.jpeg)


Broken pipelines are unavoidable. Catch problems as soon as they happen with the improved alerting suite in Dagster+.
No matter the scale or maturity of your data platform, one thing is inevitable: pipelines break. Most organizations are plagued by poor visibility into their data ecosystem, relying on the stakeholders to inform them of incorrect or missing data. It’s not possible to prevent all problems from occurring, but with the right tooling, you can catch those problems before your stakeholders do.
Every data platform is improved by observability, but setting up dedicated tools is a hassle that’s difficult to get right. Choosing an orchestrator with observability built in ensures you’ll have the deepest understanding into what’s going on, and the tools to correct issues always at your fingertips.
As part of our continued investment in observability and monitoring, we’ve fully revamped our alerting tooling in Dagster+, and are excited to share our latest release with you.
Meaningful alerts that you can trust
We established four guiding principles to drive the improvements to alerting in Dagster+.
Alerts should be simple, but flexible to configure to stay focused on the situations you care about. Alerts that are too broadly targeted and end up getting ignored are worse than not having alerts at all.
Dagster+ lets you tailor your alerts to choose exactly which assets, jobs, or code locations you care about, and what kinds of failures are worth flagging — you can even ignore certain types of flaky failures so you only get notified when you’re confident there’s a problem.
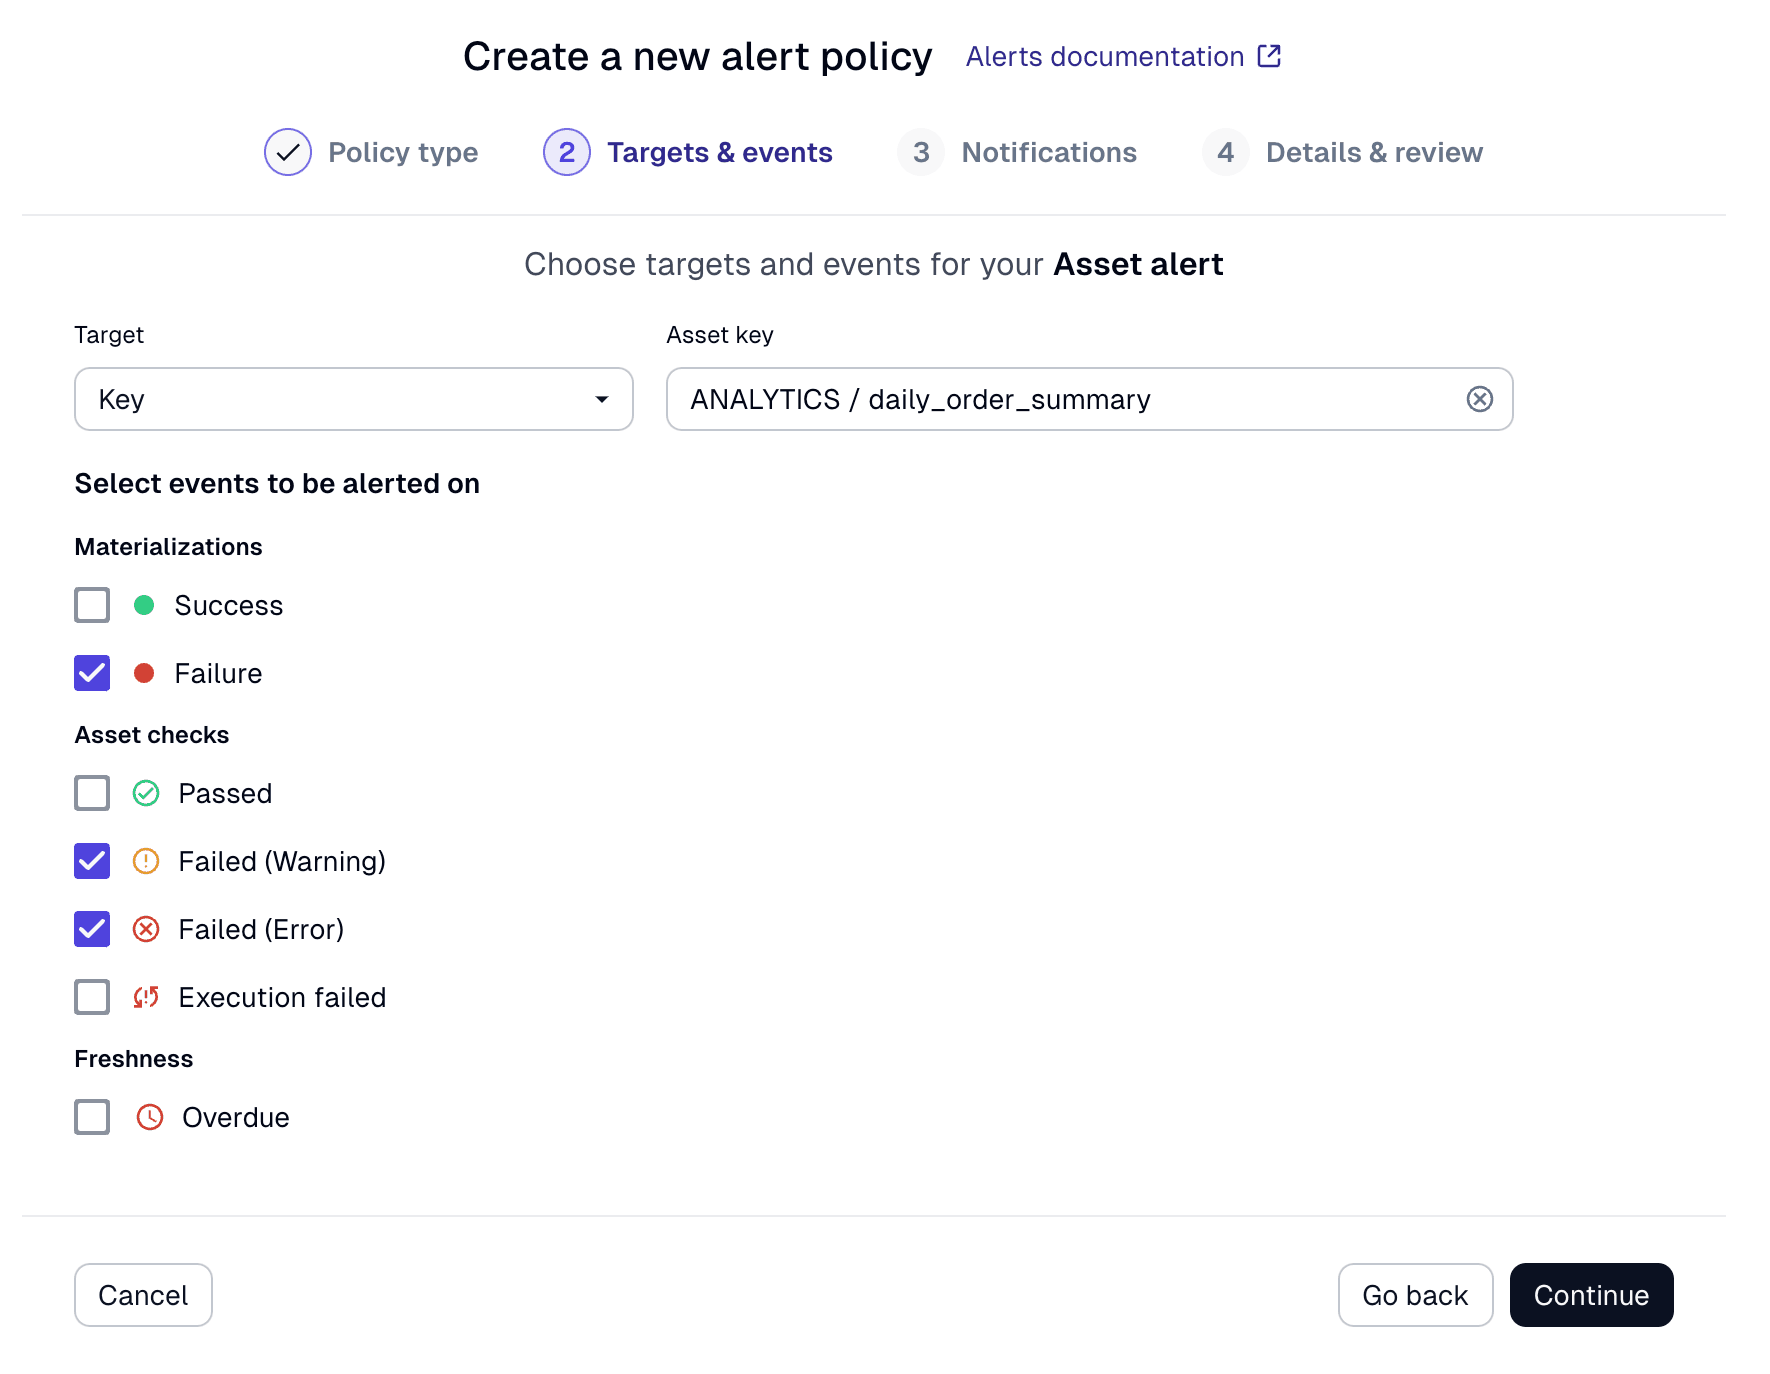
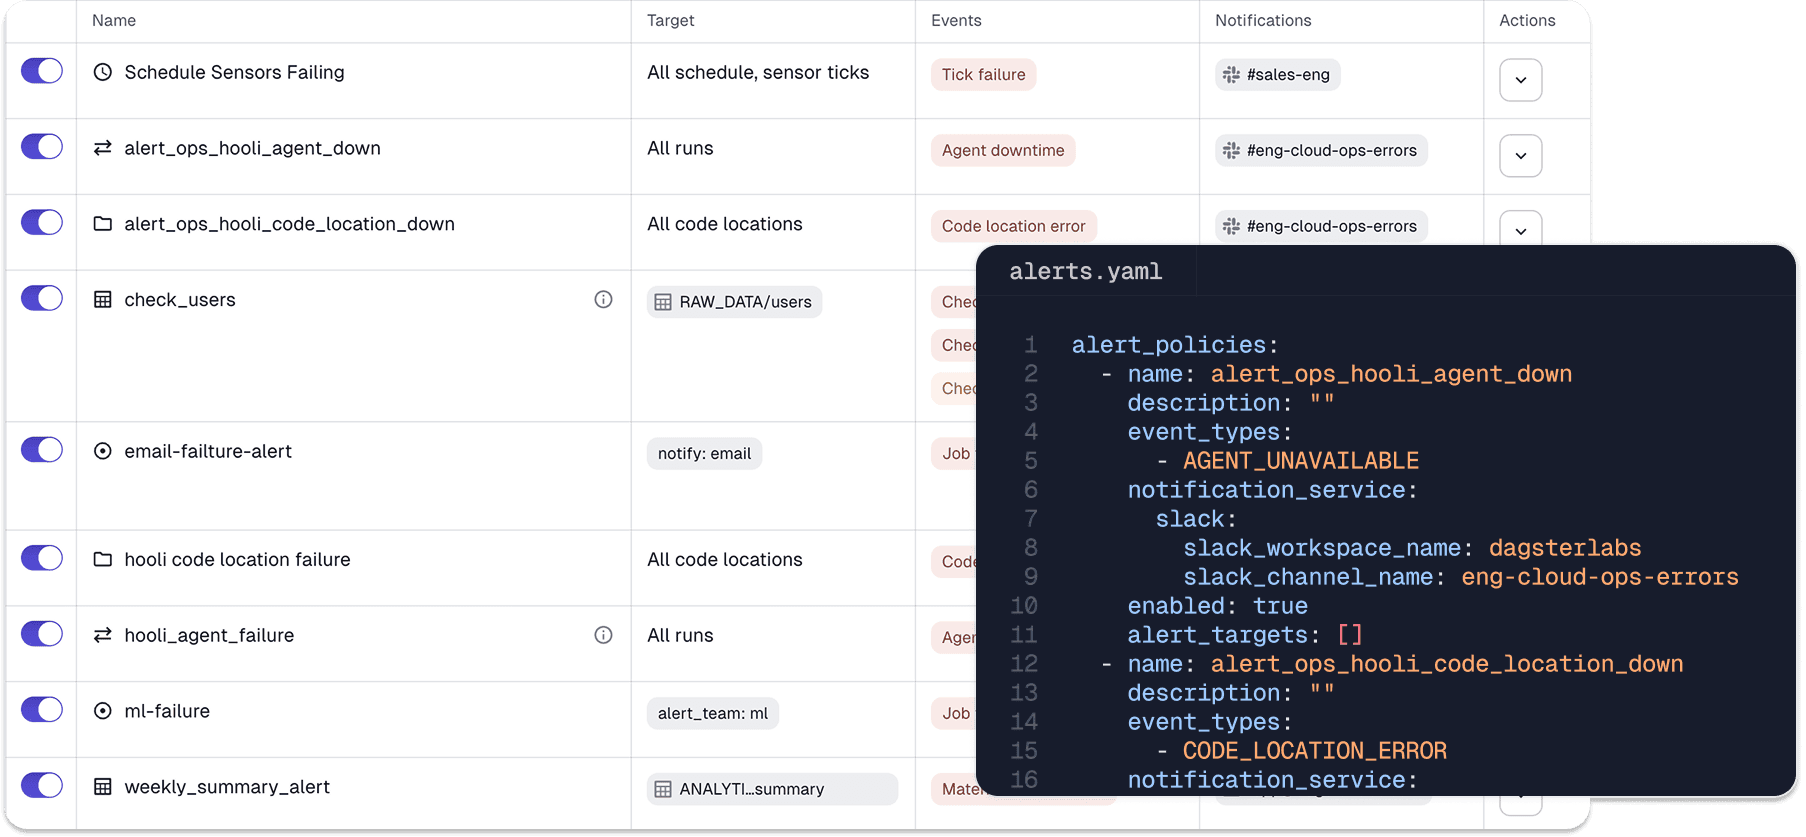
To ensure you can manage alerts in the way that works best for your organization, Dagster+ allows you to manage your alerts either through the UI, or through a config file that’s checked in to source control and synced as part of CI/CD.
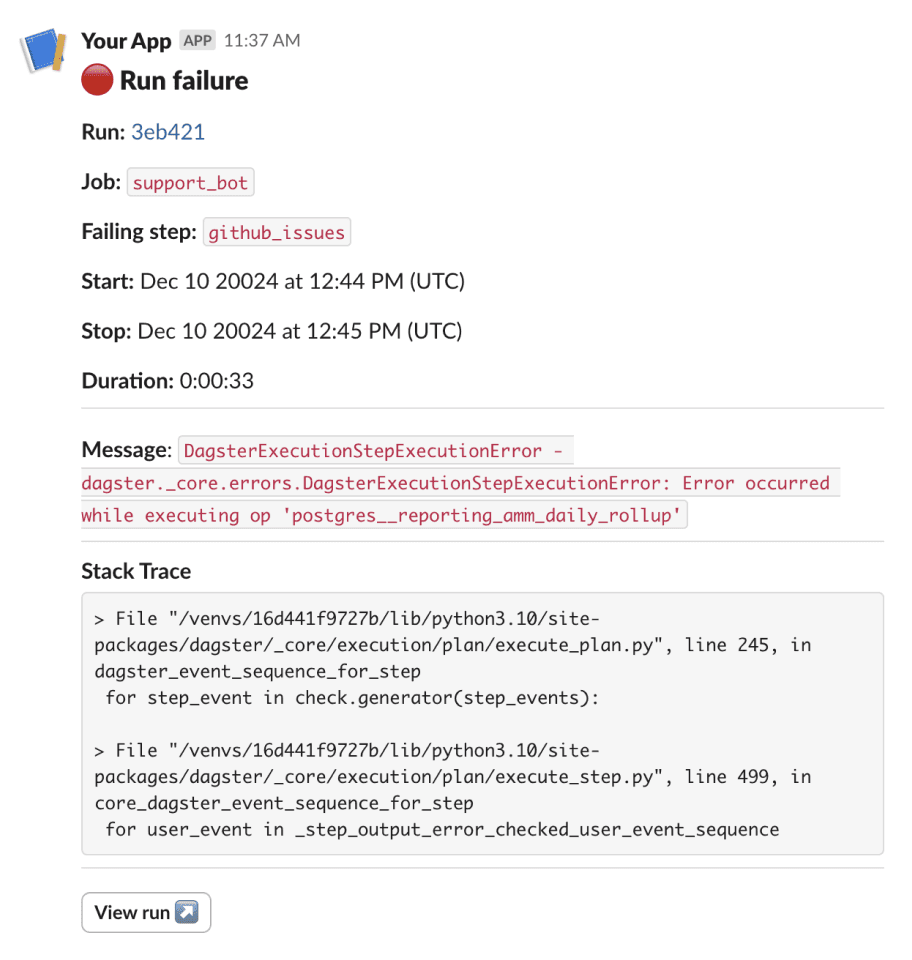
Alert notifications should be clear and actionable. We’ve improved the notifications for every type of alert to help you quickly understand what’s going wrong and how to fix it. You can also add custom content to your notifications, like a runbook with instructions for how to fix a known problem.
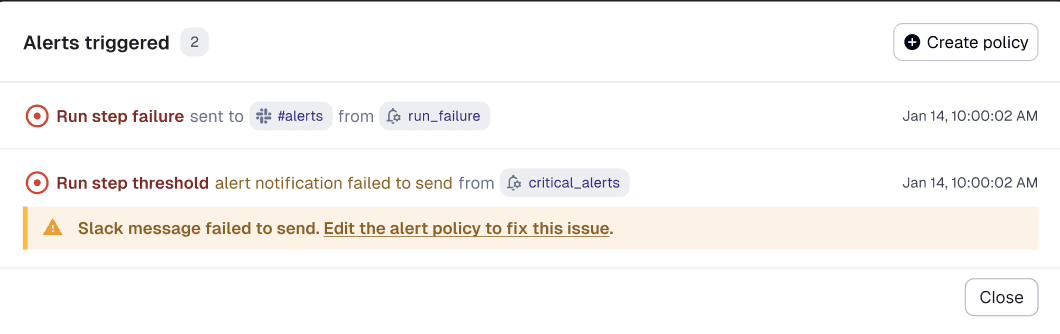
Alerts must be reliable and trustworthy — if there are problems in your platform, you don’t want to be second-guessing whether your alerts are set up correctly. We’ve improved our tooling for testing your alert configurations, and make it obvious when a notification has failed to send (such as if you deleted the Slack channel the notifications were supposed to go to).
Alerts should be shown in context, so you can act on them right away. In addition to sending notifications through whatever channel you specify (whether that’s email, Slack, MSTeams, or PagerDuty), we’ve integrated information about alerts throughout the Dagster UI, so you’re always able to tell when there’s a problem you need to act on.
How to get started
These improvements are available now in Dagster+. To start using the new alerting features:
- Navigate to your deployment settings
- Select "Alert Policies"
- Create or update your alert policies using the new options
For detailed configuration options and best practices, as well as instructions for managing alerts via the dagster CLI, check out our updated documentation.
What’s Next
This is just the beginning of our improvements to observability for your data platform. Throughout this year, we’ll be continuing to invest in areas like:
- Configuring asset freshness SLAs
- Understanding trends in your platform’s health
- Managing cost of pipelines across your platform


.jpg)
.png)


.png)

