


How to develop data pipelines using Software-defined Assets.
So you want to build a data pipeline.
Maybe it’s to:
- Take data from your application database and use it to populate your data warehouse with metrics for reporting
- Train a machine learning model that powers your product
- Take daily data exports that arrive in S3 and extract images
The Dagster Data Asset Approach
Dagster is a system for building and maintaining data pipelines. Many orchestration tools focus on executing tasks, but Dagster’s unique focus on data pipelines encourages you to view your work as the creation of data assets: the files, tables, or ML models that the pipeline creates and uses.
Building pipelines in this way has some big advantages:
- You get out-of-the-box data lineage, making data dependencies clear both within an individual pipeline and across your entire data platform.
- The relationship between tasks and data assets are clear. This means that when you encounter task failures, you can reliably understand what tables they affect. And when you find a table in your data warehouse, you can reliably understand what code generates it.
- Makes code more maintainable by avoiding unwieldy
DAGobjects. Each Dagster asset specifies the assets that it depends on, so you don’t need a separate object to tie them together. This, in turn, helps with locality of behavior.
Here, we’ll explain how to “think in assets” by walking through the process of developing a data pipeline in Dagster.
If you want to follow along with this example, you can create a self-serve account in Dagster+. Set up a free one-month Serverless trial instance in 10 minutes and edit the code directly from GitHub.
Step 1: Design Your Pipeline
Imagine you get into a heated argument with your friends about who the most important character is in your favorite TV show.
With your data engineering knowledge, you decide to build a data pipeline by fetching data about the show and analyzing it. You believe that making a report of how many times each character is mentioned in the plot for episodes will put the discussion to rest.
We’ll use the classic 90s sitcom Friends as an example, but this guide can easily be applied to any of your favorite TV shows.
When designing a data pipeline, the first step is to ask two questions:
- What data assets does the pipeline need to produce? If you're creating metrics for a stakeholder, it might mean a table they can query or a report they can view. If you're training a machine learning model to use in your company’s product, it might be the machine learning model itself.
- What source data does the pipeline need to start with? For example, you might need data from your application database, Shopify, Salesforce, or other APIs.
Let’s dive into each of these questions for the data pipeline that we’ll build.
What data assets does the pipeline need to produce?
In this case, the end goal of your data pipeline is to produce a single data asset: a report of how often each character is mentioned in the summaries of a show’s episodes.
This report will be saved into storage on your computer’s file system. Let’s call this data asset appearances_report.
What source data does the pipeline need to start with?
Let’s list out the source data needed to produce this report. You’ll need the following data sets:
- A list of the main characters for the show
- Information about which characters were included in each episode of the show
Luckily, TV Maze is an online platform and database for television shows. It offers extensive information about various TV shows, including airing schedules, complete episode lists, and plot summaries. TV Maze provides API endpoints to fetch the data sets we need. To access this data, we’ll need another piece of data: the show's ID. Therefore, we’ll also search the API to get the ID for our show.
There are three data sets you’ll need from this API:
tv_show_info, which is the metadata (such as its ID, when it premiered, etc.) about the show, from https://api.tvmaze.com/search/shows?q=friendscharacters, or a list of who the characters are, from https://api.tvmaze.com/shows/431/castepisodes, a collection of episodes and their summaries, from https://api.tvmaze.com/shows/431/episodes. We can parse the text of the episode summaries to see which characters are mentioned.
As noted, you’ll need to know the TV show's ID before getting the list of characters and episodes. This means that the episodes and characters assets depend on the tv_show_info asset.
Asset names should be based on the noun or object produced, rather than the step computed for them. For example:
- Good:
episodes - Bad:
get_episodes
If you draw out your data “pipeline” at this point, it looks something like this:
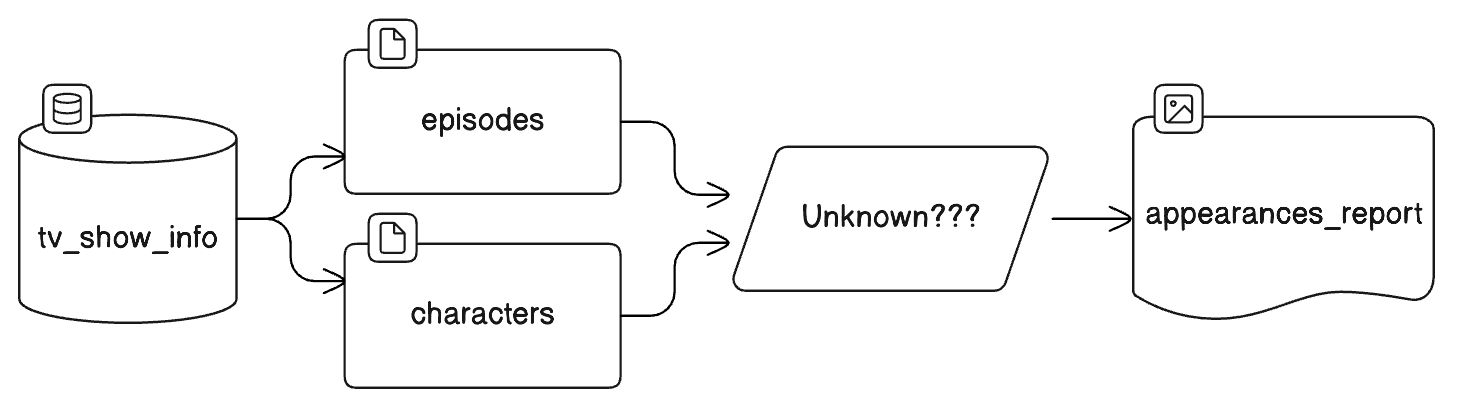
At this point, you know what you’re starting from, where you want to be. The next step is to figure out what assets are in the middle.
Assets in the Middle
In the above sketch, we broke the data pipeline into at least five steps/assets. You could write your pipeline as one big step that fetches all the data from the data sources, extracts it, transforms it, and immediately produces appearances_report.
Instead, we generally recommend making one asset per step.
There are a few reasons to break this up into multiple steps:
- Recovering After Errors: If a run fails after the data is fetched but before the report is made, then you can make your fixes and re-run your pipeline from the point of failure, rather than running the whole pipeline again. This is possible because you’ve already fetched the data and made the assets for it.
- Reusability: If you also want to do an analysis on the average episode rating per season, then reusability is possible for similar reasons as error recovery. Because your
episodesasset exists as a separate asset, extending your pipeline with a newaverage_ratingsasset is as easy as saying thataverage_ratingsdepends on theepisodesasset. - Transparency: - Having an asset per step means you know exactly what computation created an asset. You can see the relationships between steps/assets and understand how the logic flows.
Knowing this, how can we apply this to our data pipeline?
To produce the appearances_report asset, you’ll first need to produce the data that will populate the report. In this case, the data is a table that tracks the number of episodes that each character appears in. Here’s an example of what we want it to look like:
{
"Chandler": 159,
"Joey": 151,
"Monica": 169,
"Phoebe": 152,
"Rachel": 194,
"Ross": 187
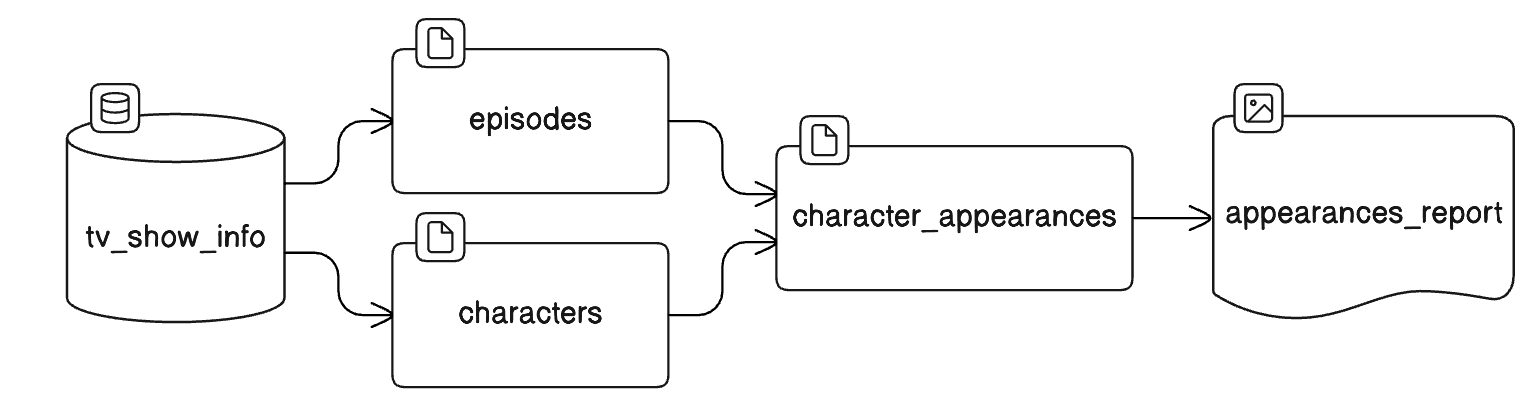
}This data set will be stored in an asset that we’ll call character_appearances. To compute character_appearances, you’ll need to go through all of the plot summaries (in episodes) and count all the times each character (from characters) is mentioned in each summary. Therefore, this new character_appearances asset depends on the episodes and characters assets.
This is how designing pipelines with assets works. You start with the end goal and work your way back, identifying what data assets are needed, breaking them down into more atomic assets, and repeating the process until you reach your data sources.
Let’s look at all the nouns
tv_show_infoepisodescharacterscharacter_appearancesappearances_report
Step 2: Implement Your Assets
To produce the data assets in your pipeline, you need to execute code. In Dagster, we call this action of executing the code to generate the asset materializing the asset.
As a framework, Dagster is flexible and un-opinionated about how your code produces an asset. For example, a valid asset materialization implementation might look like:
- Run a SQL query that creates or overwrites a table
- Execute Pandas/Polars code and write a DataFrame to a Parquet file
- Communicate with an LLM and store the output in AWS S3
- Fetch data from a service’s API and save it in your data warehouse
What’s important to note is that each of these operations creates (i.e. materializes) data.
This flexibility also means that Dagster does not have a strict definition of what happens during a materialization. The following actions are all valid materializations:
- Replacing a file by deleting the old one
- Inserting new rows into an existing table
- Or a combination of the two when working with partitions, such as an individual week or a country
The most common way in Dagster to define how an asset is materialized is with the @asset decorator. Adding this decorator to a function communicates to Dagster that the function produces an asset. By default, the name of the function is used as the name of the asset.
After installing Dagster, you'll implement your data pipeline by starting at the source data and working your way over to the last asset on the right of the flow chart. Copy and paste the code below into a Python file (call it assets.py) to write your first asset:
from dagster import asset

import requests
import json

TV_SHOW_FOR_ANALYSIS = "friends"
TV_SHOW_FILE = "show.json"

@asset
def tv_show_info():
    url_for_search = f"https://api.tvmaze.com/search/shows?q={TV_SHOW_FOR_ANALYSIS}"
    search_results = requests.get(url_for_search).json()
    top_result = search_results[0]

    with open(TV_SHOW_FILE, "w") as f:
        f.write(json.dumps(top_result))
Hopefully, this feels familiar to writing normal Python code because it is normal Python code. Dagster simplifies data orchestration by enhancing your existing code and systems with an understanding that your code produces data assets.
After implementing the first asset in the pipeline you designed, you can write out the rest of them pretty easily. For more detail on what's happening here, check out the Dagster tutorial:
from dagster import asset
import requests
import json

TV_SHOW_FOR_ANALYSIS = "friends"

TV_SHOW_FILE = "show.json"
EPISODES_FILE = "episodes.json"
CHARACTERS_FILE = "characters.json"
CHARACTER_APPEARANCES_FILE = "character_appearances.json"
APPEARANCES_REPORT_FILE = "appearances.png"

@asset
def tv_show_info():
    url_for_search = f"https://api.tvmaze.com/search/shows?q={TV_SHOW_FOR_ANALYSIS}"
    search_results = requests.get(url_for_search).json()
    top_result = search_results[0]

    with open(TV_SHOW_FILE, "w") as f:
        f.write(json.dumps(top_result))

@asset(deps=[tv_show_info])
def episodes():
    with open(TV_SHOW_FILE, "r") as f:
        show = json.loads(f.read())

    episodes_response = requests.get(f"https://api.tvmaze.com/shows/{show['show']['id']}/episodes").json()

    with open(EPISODES_FILE, "w") as f:
        f.write(json.dumps(episodes_response))

    # count the number of seasons
    seasons = set()
    for episode in episodes_response:
        seasons.add(episode["season"])

@asset(deps=[tv_show_info])
def characters():
    with open(TV_SHOW_FILE, "r") as f:
        show = json.loads(f.read())

    cast_response = requests.get(f"https://api.tvmaze.com/shows/{show['show']['id']}/cast").json()

    characters = []
    for cast_member in cast_response:
        characters.append(cast_member["character"]["name"].split(" ")[0])

    with open(CHARACTERS_FILE, "w") as f:
        f.write(json.dumps(characters))

@asset(deps=[episodes, characters])
def character_appearances():
    with open(EPISODES_FILE, "r") as f:
        episodes_response = json.loads(f.read())

    with open(CHARACTERS_FILE, "r") as f:
        characters = json.loads(f.read())
        character_appearances = {character: 0 for character in characters}

    for episode in episodes_response:
        summary = episode["summary"]
        for character in character_appearances.keys():
            character_appearances[character] += summary.count(character)

    with open(CHARACTER_APPEARANCES_FILE, "w") as f:
        f.write(json.dumps(character_appearances))

@asset(deps=[character_appearances])
def appearances_report():
    with open(CHARACTER_APPEARANCES_FILE, "r") as f:
        character_appearances = json.loads(f.read())
        character_appearances = {character: count for character, count in character_appearances.items() if count > 0}

    report = requests.get(f"https://quickchart.io/chart?c={{type:'bar',data:{{labels:{list(character_appearances.keys())},datasets:[{{label:'Appearances',data:{list(character_appearances.values())}}}]}}}}")

    with open(APPEARANCES_REPORT_FILE, "wb") as f:
        f.write(report.content)
To run your data pipeline, start Dagster by running the following command:
dagster dev -f assets.pyIf you have Dagster installed, it will start up the Dagster on your computer and give you access to its UI on http://127.0.0.1:3000/asset-groups. Here, you should see your asset graph and a Materialize all button towards the top-right corner of the screen. Click on it to run your data pipeline!
After running the whole pipeline, you should have new files (assets!) created in the same directory as your assets.py file. Open up your appearances.png file to see your appearances_report asset.
Step 3: Run it Automatically, But Only When Needed
Now that you have a pipeline that generates a set of assets, you’ll want to keep those assets up to date. Running data pipelines has historically been thought of as scheduling your set of operations on a fixed interval—say, every day or every 4 hours. However, this is often poor proxy for what you really care about: that the data is up-to-date.
Having a pipeline run daily usually means “this data needs to be up-to-date every day”. But running data pipelines can be costly. When orchestrating with an asset-based perspective, data should only be materialized when rerunning our compute will generate new results, such as when the upstream data or code changes.
In Dagster, these can be configured with auto-materialization policies—rules that define when an asset should be materialized. Some rules include:
- Materialize this asset when the assets it depends on are all updated
- Materialize this asset at 8AM every day
- Materialize this if the last time it was materialized was more than an hour ago
These rules can be combined or negated to meet the expectations for when each asset needs to be updated. This means data assets are updated precisely as needed rather than the imprecise art of running them on only a schedule.
import json

import requests
from dagster import AutoMaterializePolicy, AutoMaterializeRule, asset

TV_SHOW_FOR_ANALYSIS = "friends"

TV_SHOW_FILE = "show.json"
EPISODES_FILE = "episodes.json"
CHARACTERS_FILE = "characters.json"
CHARACTER_APPEARANCES_FILE = "character_appearances.json"
APPEARANCES_REPORT_FILE = "appearances.png"

@asset(
    auto_materialize_policy=AutoMaterializePolicy.eager.with_rules(
        AutoMaterializeRule.materialize_on_cron(cron_schedule="0 0 * * *")
    ),
)
def tv_show_info():
    url_for_search = f"https://api.tvmaze.com/search/shows?q={TV_SHOW_FOR_ANALYSIS}"
    search_results = requests.get(url_for_search).json()
    top_result = search_results[0]

    with open(TV_SHOW_FILE, "w") as f:
        f.write(json.dumps(top_result))

@asset(deps=[tv_show_info], auto_materialize_policy=AutoMaterializePolicy.eager())
def episodes():
    with open(TV_SHOW_FILE, "r") as f:
        show = json.loads(f.read())

    episodes_response = requests.get(
        f"https://api.tvmaze.com/shows/{show['show']['id']}/episodes"
    ).json()

    with open(EPISODES_FILE, "w") as f:
        f.write(json.dumps(episodes_response))

    # count the number of seasons
    seasons = set()
    for episode in episodes_response:
        seasons.add(episode["season"])

@asset(deps=[tv_show_info], auto_materialize_policy=AutoMaterializePolicy.eager())
def characters():
    with open(TV_SHOW_FILE, "r") as f:
        show = json.loads(f.read())

    cast_response = requests.get(f"https://api.tvmaze.com/shows/{show['show']['id']}/cast").json()

    characters = []
    for cast_member in cast_response:
        characters.append(cast_member["character"]["name"].split(" ")[0])

    with open(CHARACTERS_FILE, "w") as f:
        f.write(json.dumps(characters))

@asset(deps=[episodes, characters], auto_materialize_policy=AutoMaterializePolicy.eager())
def character_appearances():
    with open(EPISODES_FILE, "r") as f:
        episodes_response = json.loads(f.read())

    with open(CHARACTERS_FILE, "r") as f:
        characters = json.loads(f.read())
        character_appearances = {character: 0 for character in characters}

    for episode in episodes_response:
        summary = episode["summary"]
        for character in character_appearances.keys():
            character_appearances[character] += summary.count(character)

    with open(CHARACTER_APPEARANCES_FILE, "w") as f:
        f.write(json.dumps(character_appearances))

@asset(deps=[character_appearances], auto_materialize_policy=AutoMaterializePolicy.eager())
def appearances_report():
    with open(CHARACTER_APPEARANCES_FILE, "r") as f:
        character_appearances = json.loads(f.read())
        character_appearances = {
            character: count for character, count in character_appearances.items() if count > 0
        }

    report = requests.get(
        f"https://quickchart.io/chart?c={{type:'bar',data:{{labels:{list(character_appearances.keys())},datasets:[{{label:'Appearances',data:{list(character_appearances.values())}}}]}}}}"
    )

    with open(APPEARANCES_REPORT_FILE, "wb") as f:
        f.write(report.content)
Let’s look at the updated version of our data pipeline, and note the auto_materialize_policy attached onto each asset:
Step 4 (Bonus): Add Documentation, Metadata, and Data Quality Checks
At this point, you have a working data pipeline that can be executed both manually and automatically, to update your TV appearances report.
For a quick-and-dirty pipeline that gets you the data that you need, this is a reasonable stopping point. But if you're going to deploy this pipeline inside an organization, or run it over time, it's important to document it. It's also important to instrument it, so that you can understand what it's doing and catch problems.
Dagster lets you attach documentation to your assets, to record metadata for each materialization, and to define checks for data quality.
Dagster leverages Python’s native doc string functionality to turn the doc strings of all Dagster-decorated functions into native documentation. This documentation can be anything you feel is valuable for your end users, such as:
- A high-level summary of how the asset is produced
- Model type, infrastructure, and hyperparameters of a trained machine learning model
- Details of where the asset is stored
- Considerations, assumptions, or limitations
- Links to further documentation/architecture diagrams
@asset(deps=[tv_show_info])
def characters() -> MaterializeResult:
    """A JSON file containing the names of all the characters in the show. This is computed by
querying the TV Maze API for the cast of the show."""Here’s an example:
When materializing assets, adding metadata about the materialization helps users understand their state. You can embed helpful metadata on each materialization. Common metadata involves:
- Subsets of your data
- Performance metrics of your machine learning model
- Embedded charts
Here is an example of metadata you might add to your Friends pipeline:
@asset(
    auto_materialize_policy=AutoMaterializePolicy.eager().with_rules(
        AutoMaterializeRule.materialize_on_cron(cron_schedule="0 0 * * *")
    )
)
def tv_show_info() -> MaterializeResult:
    url_for_search = f"https://api.tvmaze.com/search/shows?q={TV_SHOW_FOR_ANALYSIS}"
    search_results = requests.get(url_for_search).json()
    top_result = search_results[0]

    with open(TV_SHOW_FILE, "w") as f:
        f.write(json.dumps(top_result))

    return MaterializeResult(
        metadata={
            "request_url": MetadataValue.url(url_for_search),
            "top_result": MetadataValue.json(top_result),
            "top_result_search_score": MetadataValue.float(top_result["score"]),
            "total_results": MetadataValue.int(len(search_results)),
        }
    )
Finally, data quality is an essential part of the data engineering process. Assets should be tested for their data quality, and these tests should be present in the data pipelines. Asset checks let you verify data quality for each asset in your pipeline. Common data quality issues to test for are:
@asset(
    deps=[episodes, characters],
    check_specs=[AssetCheckSpec(name="at_least_one_character_mentioned", asset="character_appearances")],
)
def character_appearances() -> MaterializeResult:
	# existing computation
	...

    return MaterializeResult(
        check_results=[
            AssetCheckResult(
                check_name="at_least_one_character_mentioned",
                passed=sum(character_appearances.values()) > 0,
            )
        ],
)- The detection of anomalies
- Null values in a column
- Statistical drift
Below is the final state of your code, with all assets implemented, scheduled, documented, and some with data quality tests attached:
import json

import requests
from dagster import (
    AssetCheckResult,
    AssetCheckSpec,
    AutoMaterializePolicy,
    AutoMaterializeRule,
    MaterializeResult,
    MetadataValue,
    asset,
)

TV_SHOW_FOR_ANALYSIS = "friends"

TV_SHOW_FILE = "show.json"
EPISODES_FILE = "episodes.json"
CHARACTERS_FILE = "characters.json"
CHARACTER_APPEARANCES_FILE = "character_appearances.json"
APPEARANCES_REPORT_FILE = "appearances.png"

@asset(
    auto_materialize_policy=AutoMaterializePolicy.eager().with_rules(
        AutoMaterializeRule.materialize_on_cron(cron_schedule="0 0 * * *")
    ),
    compute_kind="Python",
    group_name="ingestion",
)
def tv_show_info() -> MaterializeResult:
    """The top result from querying the TV Maze API for the TV show we want to analyze."""
    url_for_search = f"https://api.tvmaze.com/search/shows?q={TV_SHOW_FOR_ANALYSIS}"
    search_results = requests.get(url_for_search).json()
    top_result = search_results[0]

    with open(TV_SHOW_FILE, "w") as f:
        f.write(json.dumps(top_result))

    return MaterializeResult(
        metadata={
            "request_url": MetadataValue.url(url_for_search),
            "top_result": MetadataValue.json(top_result),
            "top_result_search_score": MetadataValue.float(top_result["score"]),
            "total_results": MetadataValue.int(len(search_results)),
        }
    )

@asset(
    deps=[tv_show_info],
    compute_kind="Python",
    auto_materialize_policy=AutoMaterializePolicy.eager(),
    group_name="ingestion",
)
def episodes():
    """A JSON file containing all the episodes of the show. This is computed by querying the
    TV Maze API for the episodes of the show."""
    with open(TV_SHOW_FILE, "r") as f:
        show = json.loads(f.read())

    episodes_response = requests.get(
        f"https://api.tvmaze.com/shows/{show['show']['id']}/episodes"
    ).json()

    with open(EPISODES_FILE, "w") as f:
        f.write(json.dumps(episodes_response))

    # count the number of seasons
    seasons = set()
    for episode in episodes_response:
        seasons.add(episode["season"])

    return MaterializeResult(
        metadata={
            "request_url": MetadataValue.url(
                f"https://api.tvmaze.com/shows/{show['show']['id']}/episodes"
            ),
            "num_episodes": MetadataValue.int(len(episodes_response)),
            "num_seasons": MetadataValue.int(len(seasons)),
        }
    )

@asset(
    deps=[tv_show_info],
    compute_kind="Python",
    auto_materialize_policy=AutoMaterializePolicy.eager(),
    group_name="ingestion",
)
def characters() -> MaterializeResult:
    """A JSON file containing the names of all the characters in the show. This is computed by
    querying the TV Maze API for the cast of the show."""
    with open(TV_SHOW_FILE, "r") as f:
        show = json.loads(f.read())

    cast_response = requests.get(f"https://api.tvmaze.com/shows/{show['show']['id']}/cast").json()

    characters = []
    for cast_member in cast_response:
        characters.append(cast_member["character"]["name"].split(" ")[0])

    with open(CHARACTERS_FILE, "w") as f:
        f.write(json.dumps(characters))

    return MaterializeResult(
        metadata={
            "request_url": MetadataValue.url(
                f"https://api.tvmaze.com/shows/{show['show']['id']}/cast"
            ),
            "response": MetadataValue.json(cast_response),
        }
    )

@asset(
    deps=[episodes, characters],
    check_specs=[AssetCheckSpec(name="at_least_one_character_mentioned", asset="character_appearances")],
    auto_materialize_policy=AutoMaterializePolicy.eager(),
    compute_kind="Python",
    group_name="analysis",
)
def character_appearances() -> MaterializeResult:
    """A JSON file containing the number of times each character is mentioned in the show.

    This is computed by counting the number of times each character's name appears in the summary of
    each episode."""
    with open(EPISODES_FILE, "r") as f:
        episodes_response = json.loads(f.read())

    with open(CHARACTERS_FILE, "r") as f:
        characters = json.loads(f.read())
        character_appearances = {character: 0 for character in characters}

    for episode in episodes_response:
        summary = episode["summary"]
        for character in character_appearances.keys():
            character_appearances[character] += summary.count(character)

    with open(CHARACTER_APPEARANCES_FILE, "w") as f:
        f.write(json.dumps(character_appearances))

    return MaterializeResult(
        metadata={"mentions": MetadataValue.json(character_appearances)},
        check_results=[
            AssetCheckResult(
                check_name="at_least_one_character_mentioned",
                passed=sum(character_appearances.values()) > 0,
            )
        ],
    )

@asset(
    deps=[character_appearances],
    compute_kind="Python",
    auto_materialize_policy=AutoMaterializePolicy.eager(),
    group_name="analysis",
)
def appearances_report() -> MaterializeResult:
    """A bar chart of the number of times each character is mentioned in the show. This bar chart
    is generated using [the QuickChart API](https://quickchart.io/)."""
    with open(CHARACTER_APPEARANCES_FILE, "r") as f:
        character_appearances = json.loads(f.read())
        character_appearances = {
            character: count for character, count in character_appearances.items() if count > 0
        }

    report = requests.get(
        f"https://quickchart.io/chart?c={{type:'bar',data:{{labels:{list(character_appearances.keys())},datasets:[{{label:'Appearances',data:{list(character_appearances.values())}}}]}}}}"
    )

    with open("appearances.png", "wb") as f:
        f.write(report.content)

    return MaterializeResult(metadata={"chart_url": MetadataValue.url(report.url)})
... and here are the same assets as displayed in the Dagster UI:

And your final asset: the visualisation of the data. Ross isn't who the show is most frequently about, despite your wishes.

And That’s It
This exercise walked through the thought process and steps to build a data pipeline that is focused on the assets it produces, rather than the tasks it runs. In other situations, your final assets might alternatively be tables that you share with your stakeholders or machine learning models that power your product.
You now have a data pipeline that you can test on your laptop, a set of production data assets that other people and pipelines can build on top of, and an understanding of how to think about data first when designing a pipeline.
Tinker around with it! Replace the value of TV_SHOW_FOR_ANALYSIS with your favorite and re-run your pipeline. If you liked this experience writing data pipelines, visit our documentation to get started with Dagster!


.jpg)
.png)


.png)

