


A tale of overstretched logs, counterintuitive web worker behavior, and ultimately a troublesome cursor issue.
When the Elementl team investigated an overwhelmed log stream, they ran into a counterintuitive web worker behavior and, ultimately, a troublesome cursor issue. Here is how the team got to the bottom of the issue and the lessons learned along the way.
🕴 Setting the stage
🧪 How the log viewer works
👨️ Triaging the issue
👨💻 Web workers? Not so fast…
💡 Solving the cursor issue
👩🔬 Solving the onSubscriptionData issue
💰 The end result
👩🎓 Lessons learned
🕴 Setting the stage
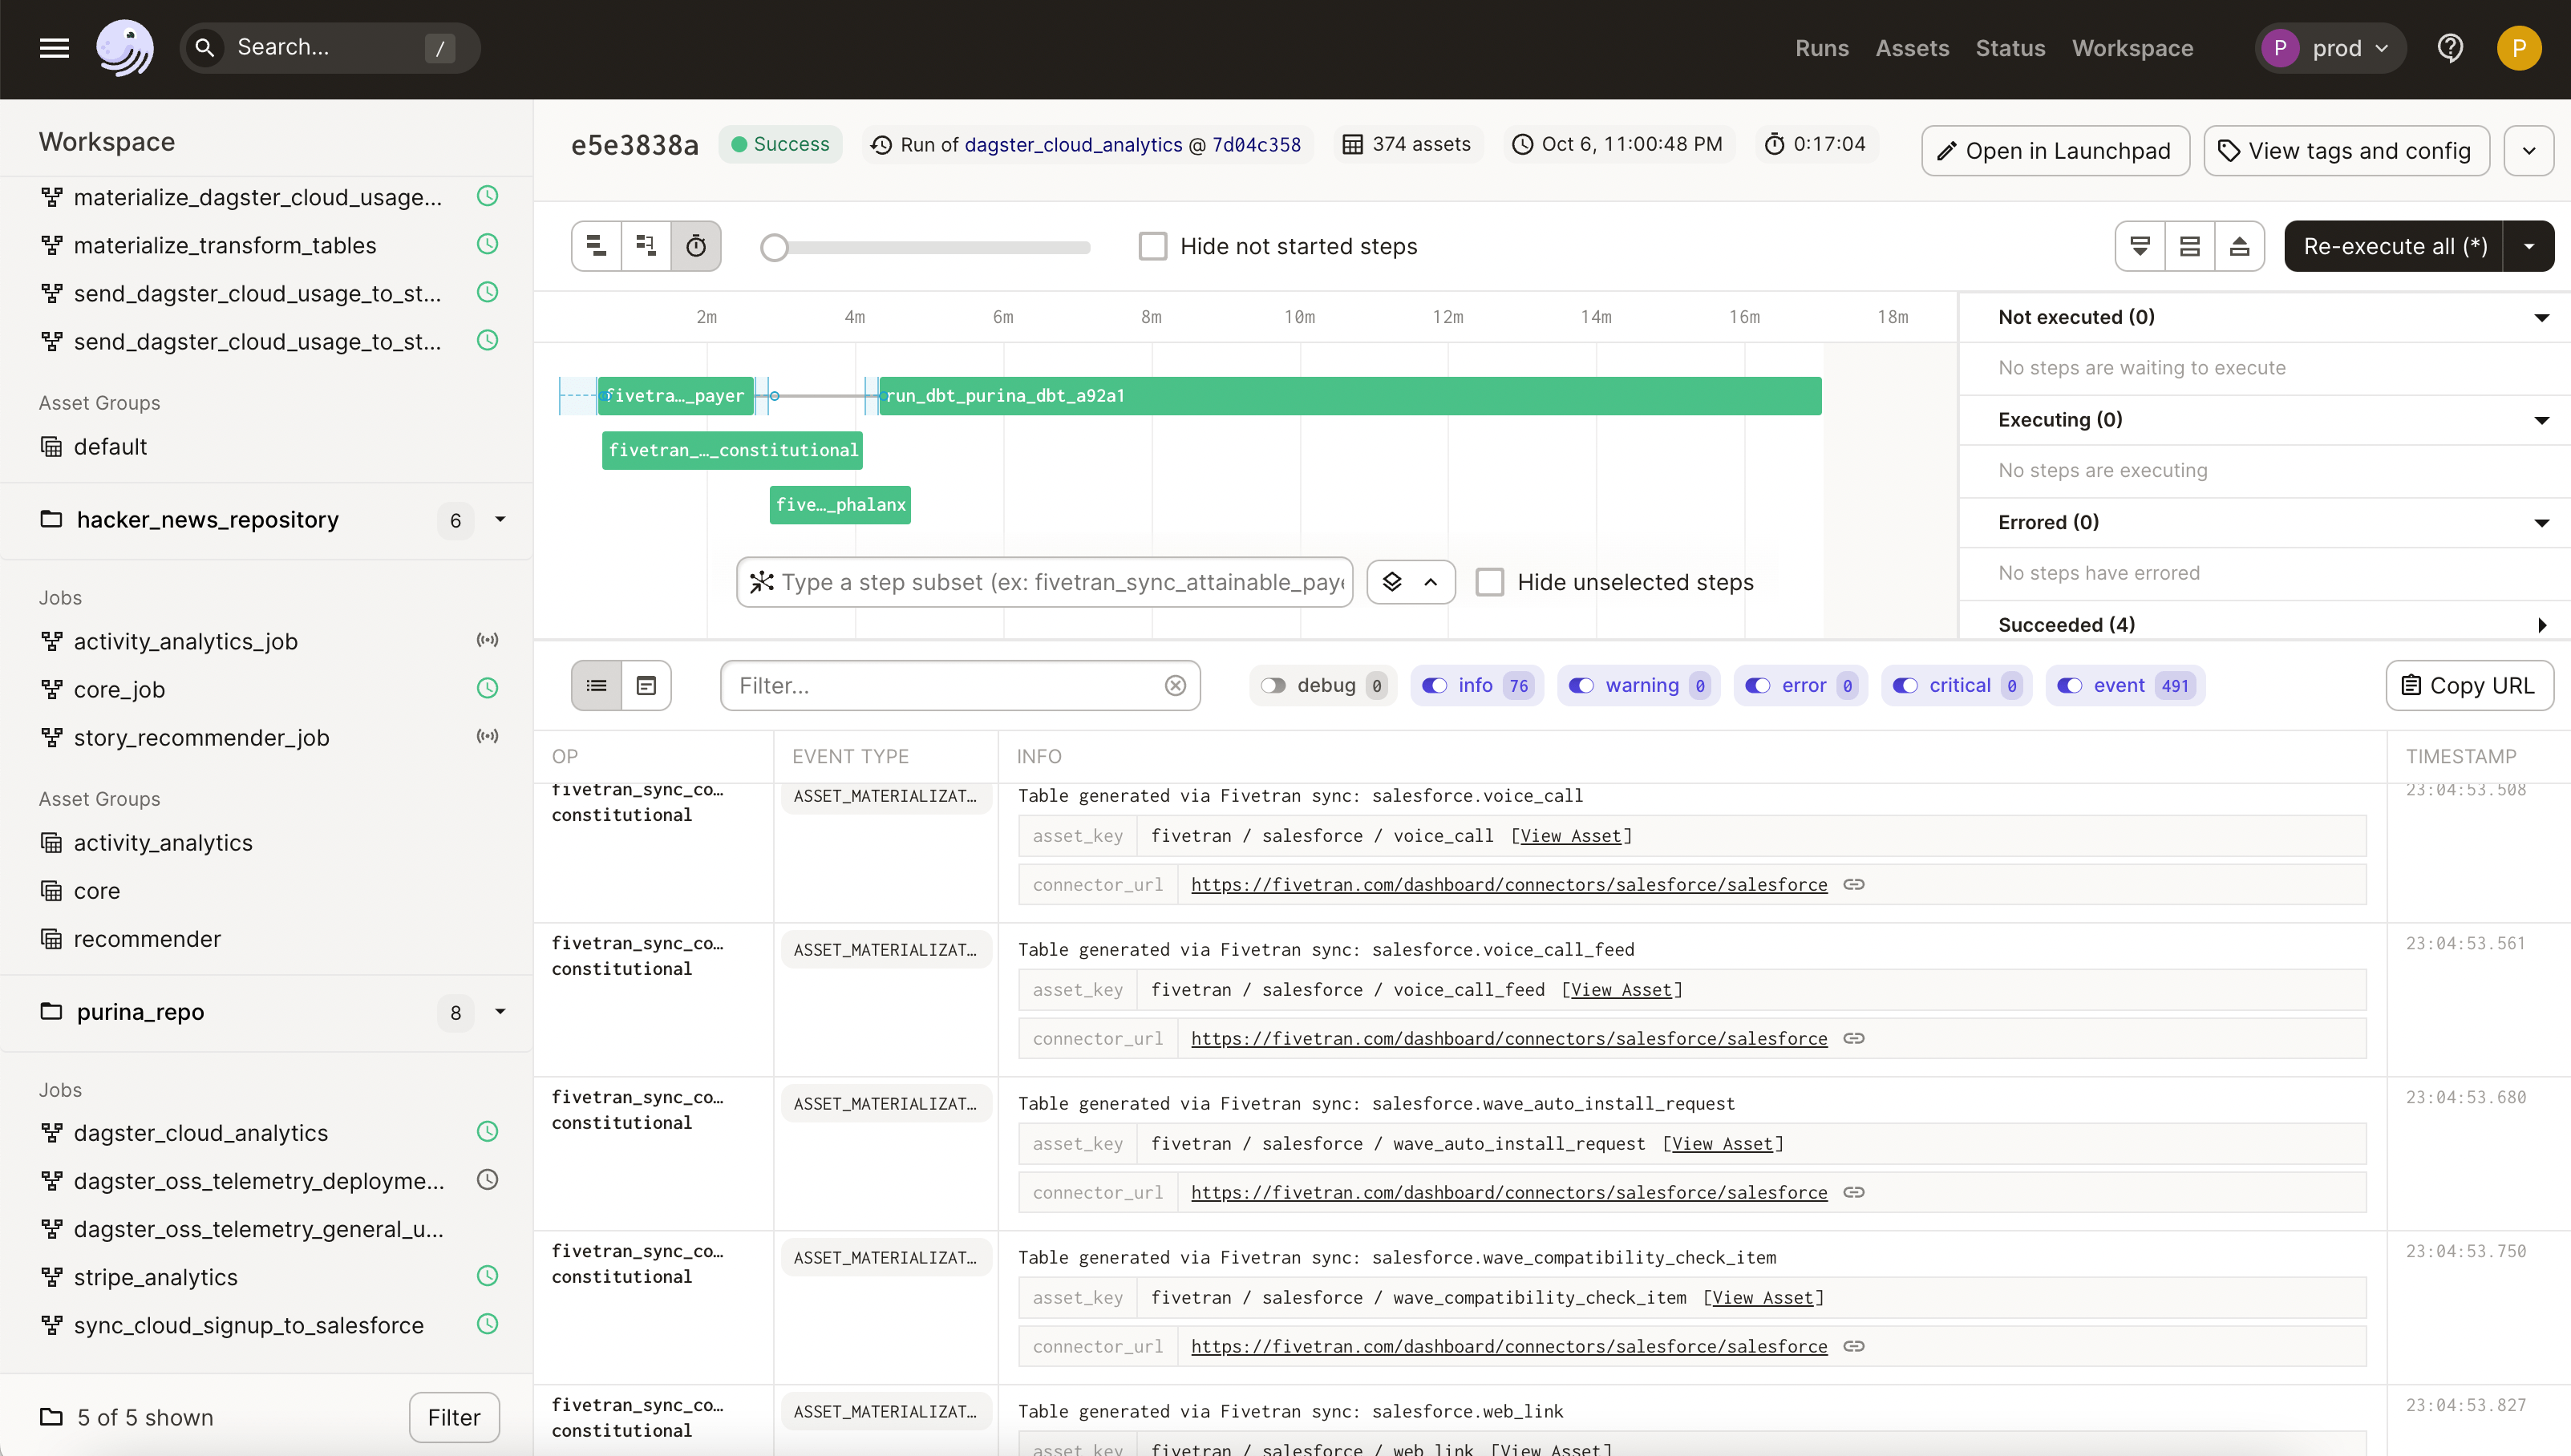
Dagster is a tool for building and running data pipelines. We have an open-source project as well as a cloud-hosted version (where we make our money). Our tool can kick off a run of a data pipeline and visualize the logs streaming in so the user can monitor and debug any issues with their pipeline.
We’re fortunate to have a great frontend engineering team, which includes former members of the React core team and a lead Stripe user interface engineer.
Recently, we launched our cloud product to the world, which led to increased usage by new and existing customers. And this led to some new and exciting problems!
🙈 Houston, we have a problem
In a startup environment, requirements are rapidly changing. What started out as a tool for local demos with a few log lines per second had turned into a large-scale multi-tenant SaaS product.
One day a customer wandered into our Slack community and brought an issue to our attention: their run page wasn’t loading. We hopped on a call and had the user walk through the problem. What we saw was surprising.
The sheer number of log lines per second far exceeded what we had ever expected or dreamed of. This user had thousands of jobs, each running dozens of individual steps, with each step throwing off a few dozen log lines per second.
We needed to get to the bottom of this to unblock the user, and ensure that this problem didn’t happen to even bigger customers in the future.
🧪 How the log viewer works
⚠️ It’s open-source! This UI is part of the Dagster open-source project.
Support the project by starring the repo!
Our app is a fairly run-of-the-mill React and TypeScript app built with create-react-app. Some of our major dependencies include:
react-routerapollostyled-componentsblueprintjs
At Elementl, we are big users of GraphQL (as you might expect - our CEO co-created it!).
On the client side, the log viewer uses Apollo’s useSubscription hook to stream logs from the server to the client. On the server, we poll from the database to retrieve batches of logs from the database and send them to the client via a websocket.
👨 Triaging the issue
We had to pin down the problem. Was it on the client? Was it on the server? Was it some interaction between them?
The first thing we did was try to reproduce the issue in our development environment. We have developed internal tooling that lets us point a development environment at production, so we were able to easily load up the problematic run in our development environment. And fortunately, we observed the exact same behavior that the customer saw.
Once we were able to reliably reproduce the issue, it was time to start digging. Our first stop was the Chrome Profiler. We noticed a few things here:
- There was consistent network traffic from the server
- The client CPU was pegged at 100%
This suggested that the client could not keep up with the server. So we could rule out issues like bad DB indexes or other server-side performance issues.
We noticed that there was a very large log volume being processed: hundreds of megabytes! Parsing this much JSON while the CPU was pegged meant that parsing and client rendering were competing for the main thread. So we did a lift-and-shift of the code to a web worker. The idea being that we could prioritize and filter this large stream of messages. Then, we would only process the small subset of what needed to be rendered on the main thread, leading to a smooth user experience.
With a move like this, you wouldn’t expect any change to the CPU utilization, since we’re simply moving the computation from one thread to another. In fact, you’d expect a slight increase in overall CPU utilization, since now we have to transfer large amounts of data between the worker and the main thread.
So when we saw a 70% drop in E2E time to load all of the logs and a subsequent decrease in CPU utilization, we were very surprised!
👨💻 Web workers? Not so fast…
Here’s the PR that added the web worker. As you can see, there’s lots of vigorous discussion. Why did this PR reduce CPU so significantly? In order to answer this, you need to understand what the use of a web worker actually entailed.
It’s not as simple as setting webWorker: true in your Apollo configuration. In order to take advantage of web workers in this context, you need to roll it yourself. That meant:
- We created a web worker that would continually fetch log entries from the server
- The worker would use
postMessage()to send those log entries to the main thread - The React app replaced its use of Apollo’s
useSubscription()hook. Instead, we useduseEffect()anduseState()to subscribe to messages from the worker and render them.
Our team stared at the Chrome Profiler and couldn’t make much progress in figuring out what happened. When profiling a large, complex application, it can be difficult to separate the signal from the noise in a large profiling trace. So instead, we opted for “caveman debugging:” we added global counters on both the server and the client to track critical operations that may lead to performance issues. These included:
- Number of logs fetched server-side
- Number of logs “thrown away” server side (finished fetching after the web socket was closed)
- Number of renders client side
We compared these counters from the web worker version against the counters from the original version.
It turned out that the original version had many more renders and logs “thrown away” than the web worker version. So what happened?
It turned out that there were two issues.
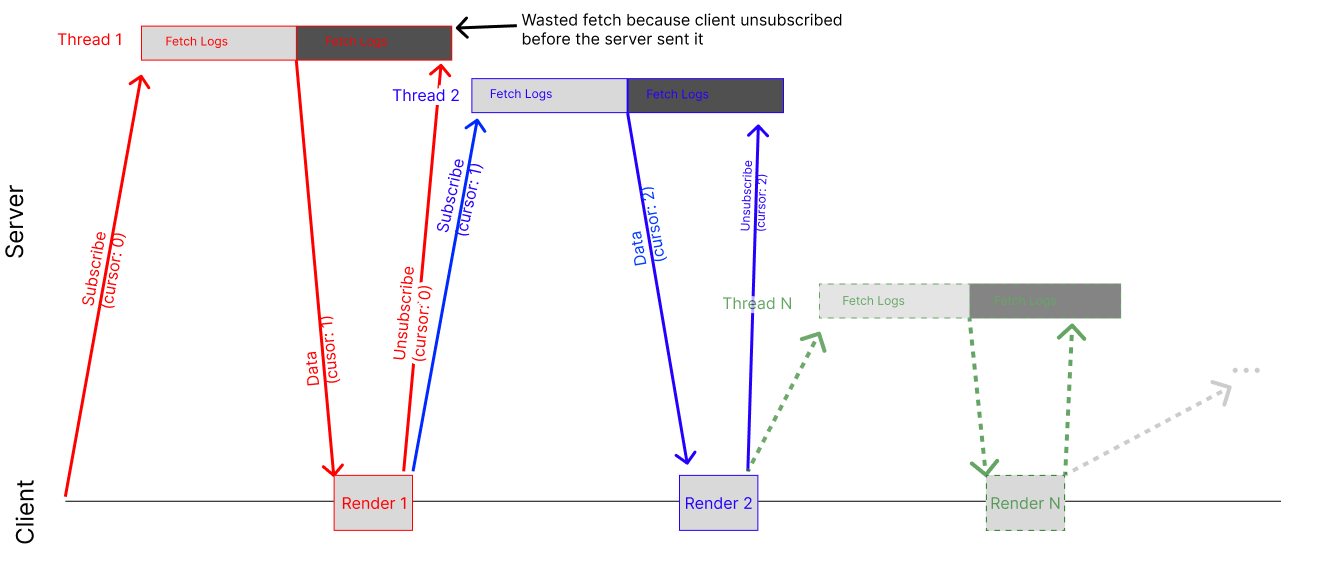
- We were passing a new
cursorvariable intouseSubscription()for every render. This led to the subscription (and websocket) being constantly torn down and re-created, causing the number of logs “thrown away” to go up, and causing most log entries to be wastefully downloaded multiple times. - We were using
onSubscriptionDatato update React state rather than the return value fromuseSubscription(). A year ago, we introduced this pattern to debounce updates from Apollo subscriptions to improve performance in another part of our app. As we updated versions of Apollo and refactored our application, at some point this change led to every update from every subscription triggering two renders instead of 1, effectively cutting our frontend performance in half.
Now that we had identified the root causes, it was time to solve the problem.
💡 Solving the cursor issue
Deep in our codebase, we were updating cursor to reference the last log entry we’d received from the server. As new log entries came in, the cursor variable would be updated.
This caused an issue because every time we updated the cursor value, Apollo would tear down the old subscription and recreate a new one. This would, in turn, trigger a refetch of all data, which was expensive and resulted in the same messages being wastefully fetched, parsed and rendered multiple times.
To solve the problem, we found a way to restructure our query to not include the use of the cursor variable. This resulted in a single, long-lived subscription.
Here’s the PR that fixed the issue.
👩🔬 Solving the onSubscriptionData issue
For this one, we literally just Googled it and did what Stack Overflow said. In this case, we kept the code largely unchanged, and simply moved our use of useSubscription() into a component that simply returned null. That way, the extraneous renders that were being triggered by useSubscription() would be extremely cheap because the component had virtually no re-render cost.
Here’s the PR that fixed this issue.
💰 The end result
We ended up deploying both of the root cause fixes and skipping the web worker entirely. This ended up solving the problem without introducing the overhead and complexity associated with web workers. And - most importantly - we made our users happy.
👩🎓 Lessons learned
Solving this performance issue was quite the adventure, and we learned a lot along the way. Here are a few of the key takeaways:
- Always profile. The profiler is an important tool in your toolbox and can help you rapidly identify areas of concern.
- Use your intuition. The profiler is not a perfect tool and can be quite noisy. It’s important to have a deep understanding of the system as a whole so you can use techniques like manually adding performance counters to diagnose the issue at a higher level.
- Solving for one performance problem can cause another. We had introduced an
onSubscriptionDatacallback to solve for a performance problem a long time ago. The fix for that performance issue ended up partially causing this one. - Even experts use Google and Stack Overflow. Our team has a ton of experience, and has worked on numerous complex applications and frontend frameworks. In this situation, we ended up Googling one of the answers and spiritually copy-pasting from Stack Overflow.
If you want to support the Dagster Open Source project, be sure to Star our Github repo.


.jpg)
.png)


.png)

