Anomaly detection definition:
Anomaly detection helps to identify outliers and anomalies in your data that could skew results or indicate underlying issues in the data. Here are some best practices for implementing anomaly detection in Python:
- Understand the data: Before implementing any anomaly detection techniques, it's important to have a thorough understanding of the data being analyzed. This includes understanding the distribution of the data, any trends or patterns, and any known anomalies. Python libraries such as Pandas, NumPy, and Matplotlib can be used to perform exploratory data analysis and gain insights into the data.
- Choose appropriate algorithms: There are many different algorithms available for anomaly detection, and the choice of algorithm will depend on the specific use case and the characteristics of the data being analyzed. Some common algorithms for anomaly detection include Isolation Forest, Local Outlier Factor (LOF), and One-class SVM. Python libraries such as Scikit-learn and PyOD provide implementations of these algorithms.
- Evaluate performance: It's important to evaluate the performance of any anomaly detection algorithm to ensure that it is accurately identifying anomalies without generating too many false positives. This can be done by calculating metrics such as precision, recall, and F1 score. Python libraries such as Scikit-learn provide functions for calculating these metrics.
- Incorporate into your data pipeline: Anomaly detection should be incorporated into the overall data pipeline, ideally as close to the data source as possible. This can be done using Python libraries such as Apache Kafka or AWS Kinesis to stream data to an anomaly detection model. Once an anomaly is detected, an alert can be generated to notify data engineers or data scientists.
Here are some specific Python functions that can be used for anomaly detection using the Scikit-learn library. Install Scikit-learn with pip install -U scikit-learn:
- Matplotlib installation instructions are found here but basically just involves the command
python -m pip install -U matplotlib.
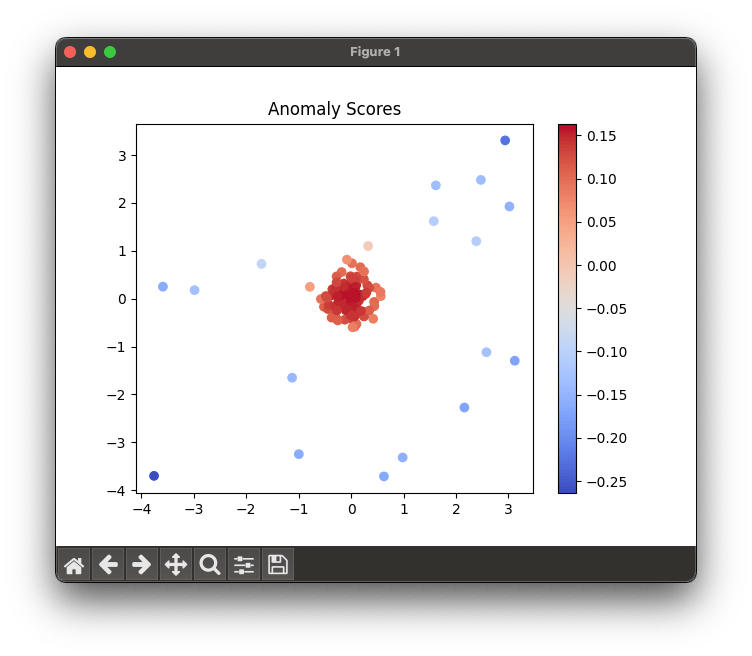
IsolationForest: A class that implements the Isolation Forest algorithm for anomaly detection. It works by creating random partitions of the data and identifying outliers based on the number of partitions required to isolate the data point.
Please note that you need to have the necessary Python libraries installed in your Python environment to run this code.
import numpy as np
import matplotlib.pyplot as plt
from sklearn.ensemble import IsolationForest

# Generate some sample data with anomalies
np.random.seed(42)
X = 0.3 * np.random.randn(100, 2)
X_outliers = np.random.uniform(low=-4, high=4, size=(20, 2))
X = np.vstack([X, X_outliers])

# Fit the isolation forest model
clf = IsolationForest(random_state=42)
clf.fit(X)

# Predict the anomaly scores for each point in the data
scores = clf.decision_function(X)

# Visualize the results
plt.scatter(X[:, 0], X[:, 1], c=scores, cmap='coolwarm')
plt.colorbar()
plt.title('Anomaly Scores')
plt.show()
Which will produce the following graph:
LocalOutlierFactor: A class in the Scikit-learn library that implements the LOF algorithm for anomaly detection. It works by comparing the local density of a data point to the density of its neighbors, and identifying points with significantly lower density as anomalies.
from sklearn.neighbors import LocalOutlierFactor
from sklearn.datasets import load_iris

# Load the iris dataset
X, y = load_iris(return_X_y=True)

# Fit the local outlier factor model
clf = LocalOutlierFactor(n_neighbors=20, contamination=0.1)
y_pred = clf.fit_predict(X)

# Print the predicted labels for each point
print(y_pred)
With the output looking like this:
[ 1  1  1  1  1  1  1  1  1  1  1  1  1 -1 -1 -1  1  1  1  1  1  1  1  1
  1  1  1  1  1  1  1  1  1 -1  1  1  1  1  1  1  1 -1  1  1  1  1  1  1
  1  1  1  1  1  1  1  1  1 -1  1  1 -1  1  1  1  1  1  1  1  1  1  1  1
  1  1  1  1  1  1  1  1  1  1  1  1  1  1  1  1  1  1  1  1  1 -1  1  1
  1  1 -1  1  1  1  1  1  1 -1 -1  1  1  1  1  1  1  1  1  1  1 -1 -1  1
  1  1 -1  1  1  1  1  1  1  1  1 -1  1  1  1  1  1  1  1  1  1  1  1  1
  1  1  1  1  1  1]
Precision, Recall, F1 score: Functions in the Scikit-learn library that can be used to evaluate the performance of an anomaly detection algorithm.
from sklearn.metrics import precision_score, recall_score, f1_score
from sklearn.datasets import make_classification
import numpy as np

# Generate some sample data
X, y_true = make_classification(n_samples=1000, n_features=10, n_classes=2)

# Generate some random predictions
y_pred = np.random.randint(0, 2, size=len(y_true))

# Calculate precision, recall, and F1 score
precision = precision_score(y_true, y_pred, average='binary')
recall = recall_score(y_true, y_pred, average='binary')
f1 = f1_score(y_true, y_pred, average='binary')

# Print the results
print('Precision:', precision)
print('Recall:', recall)
print('F1 score:', f1)
which yields:
Precision: 0.5077220077220077
Recall: 0.526
F1 score: 0.5166994106090373
By following these best practices and using appropriate Python functions for anomaly detection, data engineers can ensure that their data pipelines are effectively detecting and handling anomalies in the data.
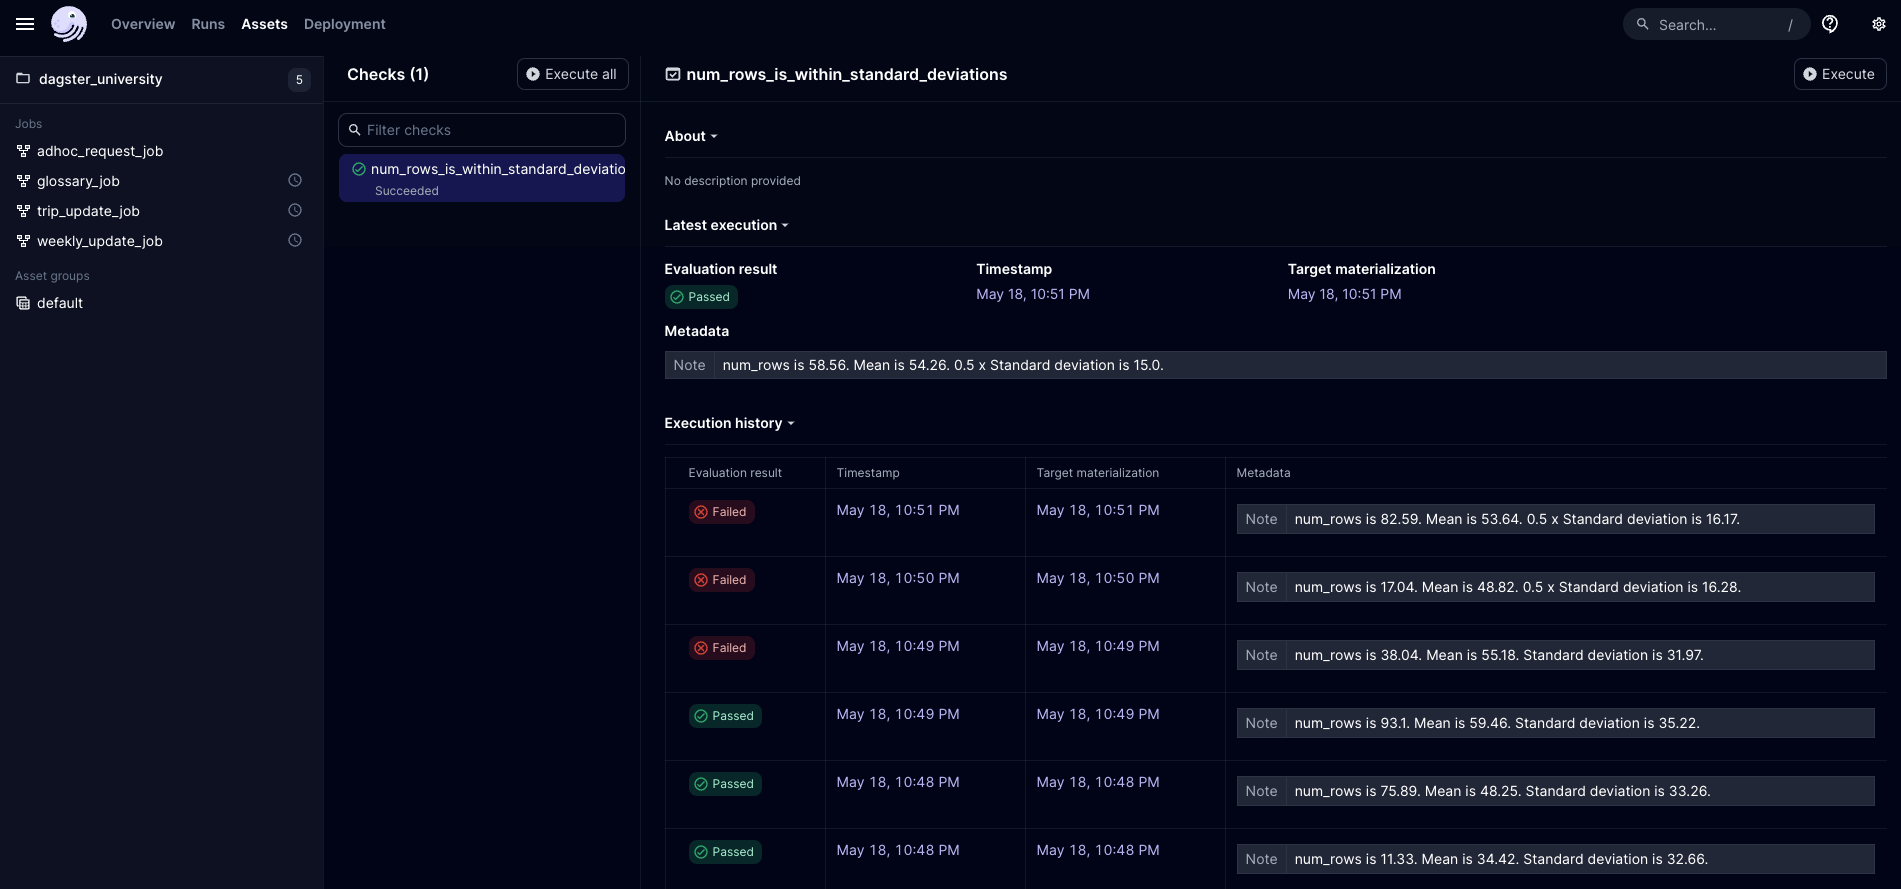
Anomaly detection in Dagster
With Dagster, you can use asset checks to compare current data against historical materializations to detect anomalies. For example, you can write an asset check that compares the number of null values in a column against historical values and fails the check if the current number of nulls appears anomalous.
Here's an example of how you might implement such an asset check in Dagster:
from dagster import asset, asset_check, AssetCheckResult, MaterializeResult, EventRecordsFilter, DagsterEventType, AssetKey
import statistics
import random

random.seed()

@asset
def asset1():
    """
    A test asset for asset checks
    """
    num_rows = 0
    num_rows = random.random()*100
    return MaterializeResult(metadata={"num_rows": num_rows})

@asset_check(asset=asset1)
def num_rows_is_within_standard_deviations(context):

    min_materialization = 3

    records = context.instance.get_event_records(
        EventRecordsFilter(DagsterEventType.ASSET_MATERIALIZATION, asset_key=AssetKey("asset1")),
        limit=1000,
    )
    # Count the number of materializations
    materialization_count = len(records)


    if materialization_count >= min_materialization:
        num_rows_values = [
            record.asset_materialization.metadata["num_rows"].value for record in records
        ]
        mean = statistics.mean(num_rows_values[:-1])
        stdev = statistics.stdev(num_rows_values[:-1])

        return AssetCheckResult(
            passed=abs(num_rows_values[0] - mean) <= stdev,
            metadata={"Note": f"num_rows is {round(num_rows_values[0],2)}. Mean is {round(mean,2)}. Standard deviation is {round(stdev,2)}."}
        )

    else:
        # The check does not make sense until we get to the 3rd materialization of the asset
        return AssetCheckResult(
            passed=True,
            metadata={"Note": "This check can only execute on the 3rd materialization onwards."}
)This code snippet defines an asset and an asset check that uses historical materialization metadata to determine if the current number of rows is within one standard deviation of the mean of the previous materializations. If it's not, the check fails, indicating a potential anomaly.