Blog
Announcing 4 New Integrations: Dagster + Your Favorite BI Tools

Announcing 4 New Integrations: Dagster + Your Favorite BI Tools

November 14, 2024
Announcing 4 New Integrations: Dagster + Your Favorite BI Tools

We're excited to announce four new integrations between Dagster and some of the most widely used business intelligence (BI) tools: Looker, Power BI, Tableau, and Sigma. These integrations are designed to provide deeper insights into how your data flows from source to dashboard, making it easier to manage and understand your data ecosystem.

-
   -  

A complete asset graph with real end-to-end pipelines

Data assets orchestrated by Dagster often power dashboards and other assets in business intelligence (BI) tools like Looker, Power BI, and Tableau. The lineage between these BI assets and the assets they depend on is crucial for understanding where dashboard data comes from, how data is being used, and debugging issues when they arise.

By representing BI assets directly in the Dagster asset graph, these integrations provide a clear picture of how data flows throughout your organization and break down the silos between your analytics engineers and data analysts. If a Dagster-managed asset becomes stale or encounters a data quality issue, you can now immediately understand the downstream impact all the way to the BI tool. This visibility helps ensure that upstream data asset changes are accurately reflected in dashboards and reports.

-
   -  

With the addition of capabilities to trigger compute processes in your BI tools for cached assets in Looker, Tableau, Sigma, and PowerBI, you no longer have to rely on chaining together scheduled processes to ensure that BI assets are updated, cached, and distributed to your key stakeholders. You can now build truly integrated pipelines spanning from source data to the visualization layer.

These integrations also make Dagster a one-stop shop for learning about data assets, offering users a complete view of their analytics environment. For data consumers, this means having insights not just into the tables in their warehouse but also into the dashboards and reports that depend on them.

What's being released

-
   -  

That's why we're excited to introduce four new integrations, each designed to streamline your data workflows and make your BI tools even more powerful:

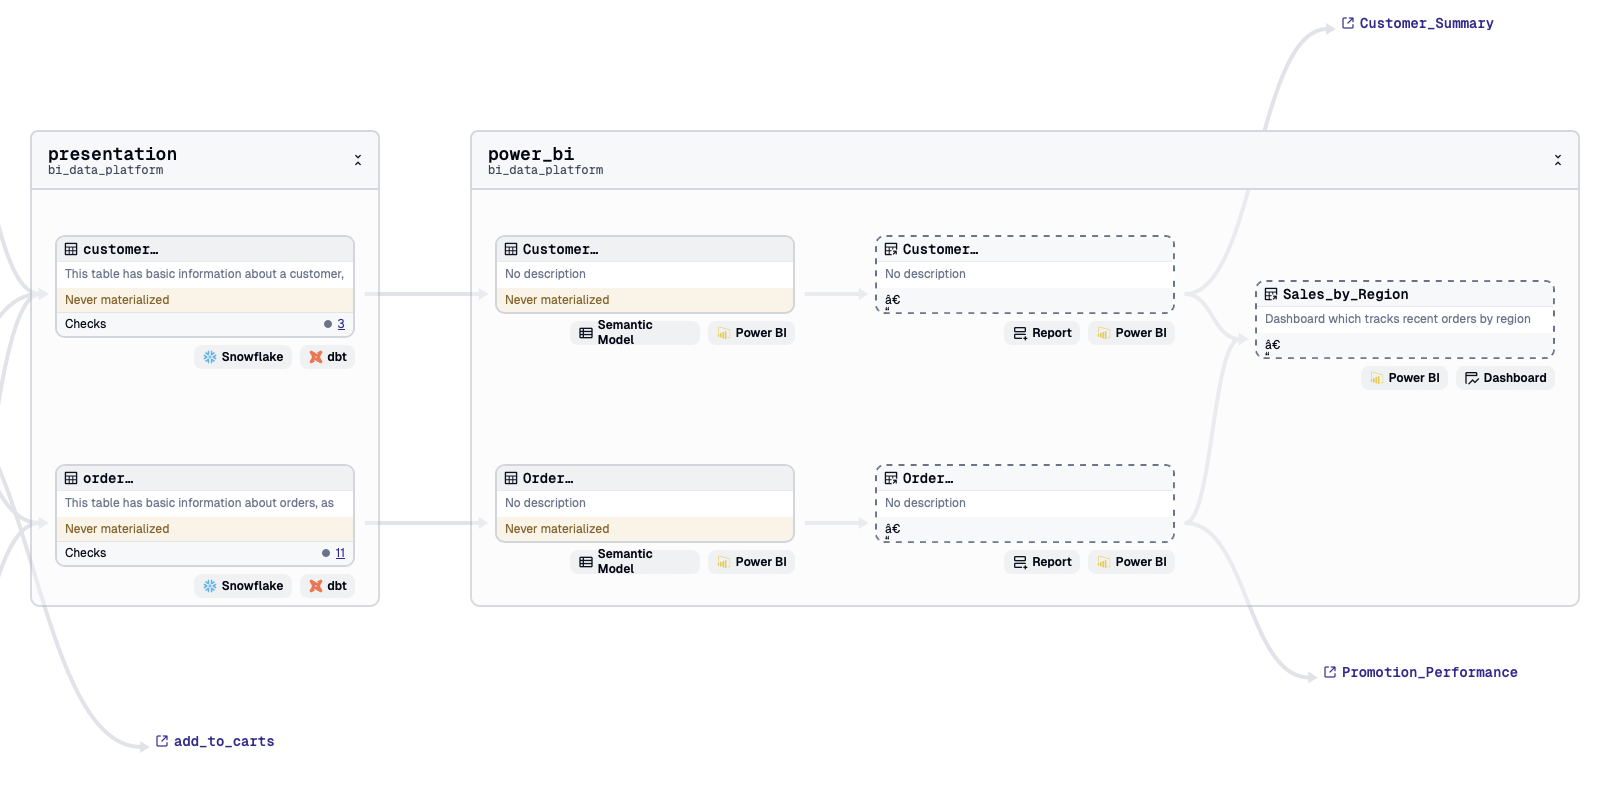
Power BI: Our Power BI integration lets you Sigma: The Dagster Sigma integration—available in a fully featured preview release—lets you bring datasets and workbooks into the Dagster asset graph. This gives your data teams better visibility into how your Sigma assets are leveraging data across the organization and gains visibility into downstream data usage. Get started with this demo and the docs.

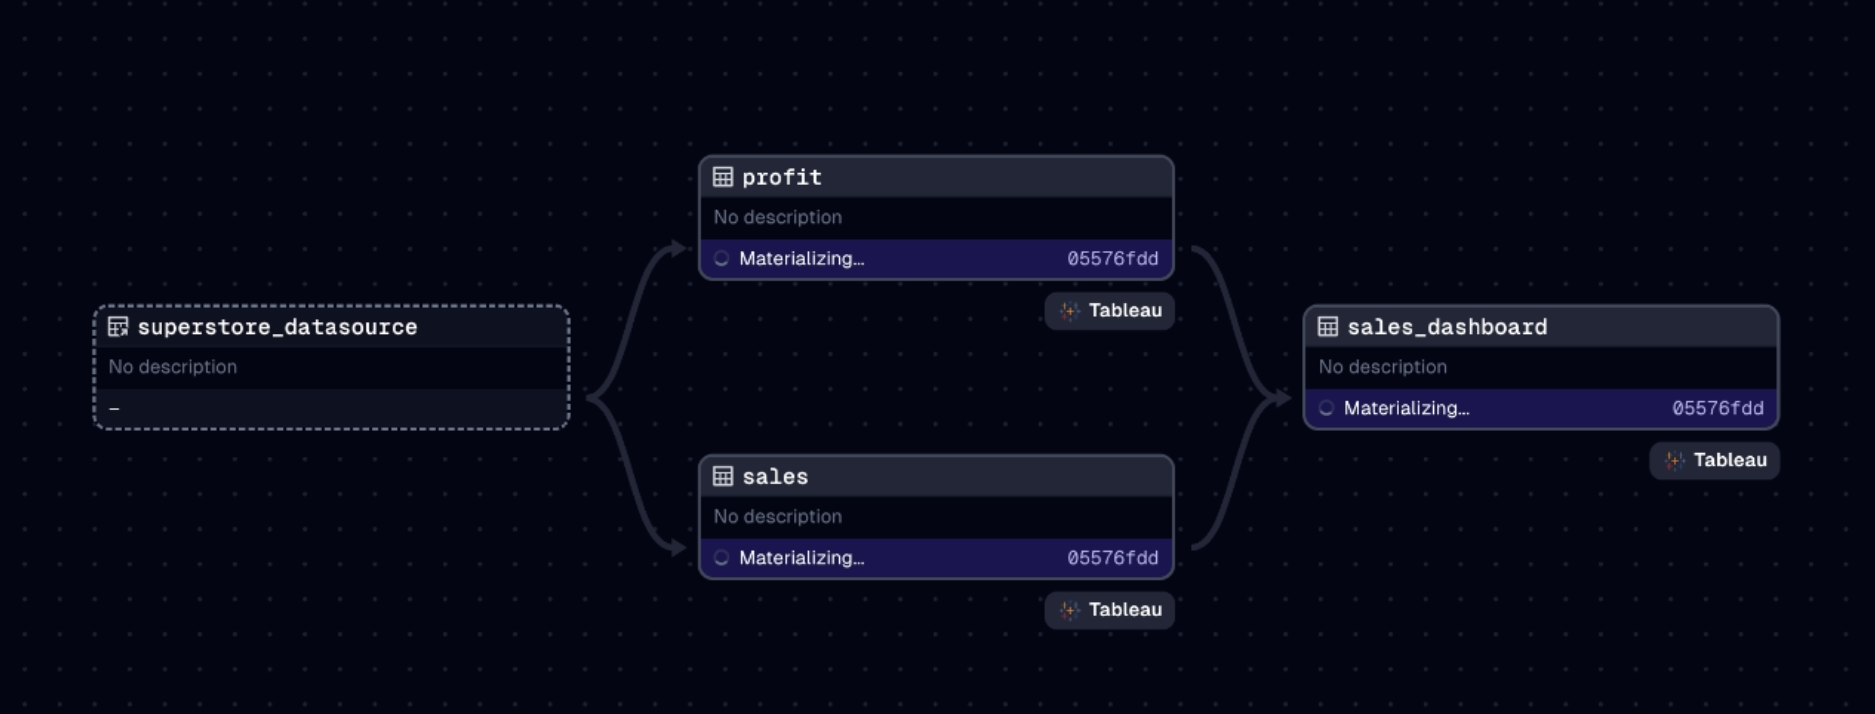
Tableau: With our Tableau integration, you can pull data sources, sheets, and dashboards into Dagster as assets. This integration allows for seamless orchestration of data refreshes, ensuring that updates to upstream data are reflected in your Tableau dashboards. (Demo, docs.)

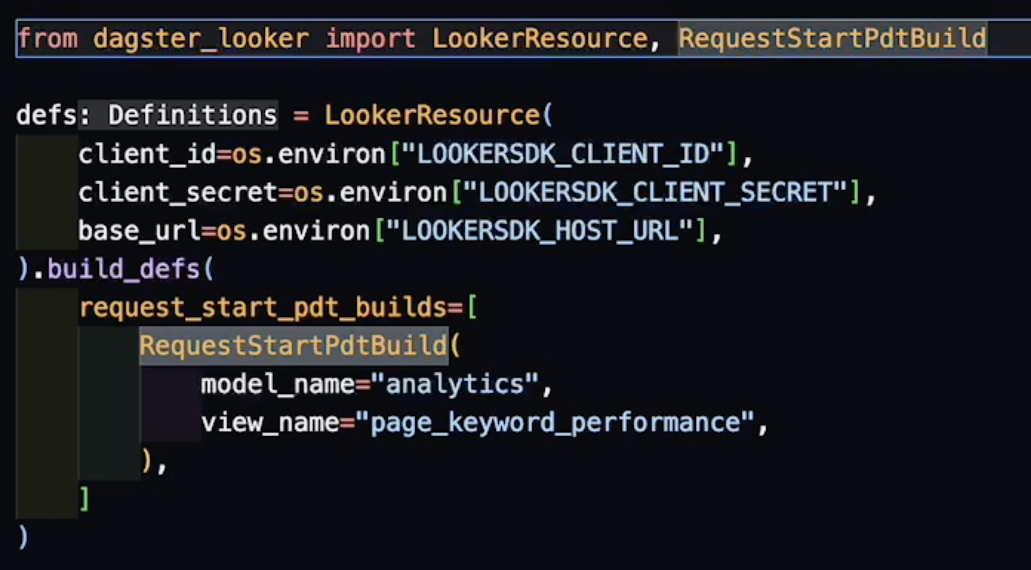
Looker: Our Looker integration connects your Looker model dashboards and views with the Dagster data catalog and global asset lineage graph. Additionally, this integration supports materializing persistently derived tables (PDTs) with just a few lines of code. (Demo, docs.)

These integrations are not only about representing BI assets in Dagster—they also enable you to orchestrate updates, ensuring your BI tools reflect the most current data from upstream sources. This makes managing data refreshes simpler and more reliable without relying on clunky cron jobs or manual updates.

-
   -  

What's Next?

We're already working on several improvements to make these integrations even better, including:

  • Enhanced User Experience: Expect UX improvements to the asset graph and asset details pages, such as deep linking directly back to definitions in your BI tools. This will make navigating between Dagster and your BI environment even easier.
  • Expanding Integrations: We're also exploring partnerships with other BI tools. Let us know if there's a BI integration you're excited about
  • Integration Toolkit: We're considering creating a toolkit or guide that gives developers and data teams more control and flexibility for creating their own integrations.

These future enhancements are all part of our mission to help organizations build productive, scalable data platforms by offering a unified control plane for their data and a single pane of glass to visualize it.

Get Started Today

All four integrations are available now, and we're eager to hear your feedback. Whether you're using Looker, Power BI, Tableau, or Sigma, these integrations will help you better understand your data flows and keep your BI assets in sync with your data pipelines.

Dive into the documentation to get started, and let us know how we can continue to improve your experience with Dagster and your BI tools!

Have feedback or questions? Start a discussion in Slack or Github.

Interested in working with us? View our open roles.

Want more content like this? Follow us on LinkedIn.

Dagster Newsletter

Get updates delivered to your inbox

Latest writings

The latest news, technologies, and resources from our team.

Multi-Tenancy for Modern Data Platforms
Webinar

April 7, 2026

Multi-Tenancy for Modern Data Platforms

Learn the patterns, trade-offs, and production-tested strategies for building multi-tenant data platforms with Dagster.

Deep Dive: Building a Cross-Workspace Control Plane for Databricks
Webinar

March 24, 2026

Deep Dive: Building a Cross-Workspace Control Plane for Databricks

Learn how to build a cross-workspace control plane for Databricks using Dagster — connecting multiple workspaces, dbt, and Fivetran into a single observable asset graph with zero code changes to get started.

Dagster Running Dagster: How We Use Compass for AI Analytics
Webinar

February 17, 2026

Dagster Running Dagster: How We Use Compass for AI Analytics

In this Deep Dive, we're joined by Dagster Analytics Lead Anil Maharjan, who demonstrates how our internal team utilizes Compass to drive AI-driven analysis throughout the company.

Monorepos, the hub-and-spoke model, and Copybara
Blog

April 3, 2026

Monorepos, the hub-and-spoke model, and Copybara

How we configure Copybara for bi-directional syncing to enable a hub-and-spoke model for Git repositories

Making Dagster Easier to Contribute to in an AI-Driven World
Blog

April 1, 2026

Making Dagster Easier to Contribute to in an AI-Driven World

AI has made contributing to open source easier but reviewing contributions is still hard. At Dagster, we’re improving the contributor experience with smarter review tooling, clearer guidelines, and a focus on contributions that are easier to evaluate, merge, and maintain.

DataOps with Dagster: A Practical Guide to Building a Reliable Data Platform
Blog

March 17, 2026

DataOps with Dagster: A Practical Guide to Building a Reliable Data Platform

DataOps is about building a system that provides visibility into what's happening and control over how it behaves

How Magenta Telekom Built the Unsinkable Data Platform
Case study

February 25, 2026

How Magenta Telekom Built the Unsinkable Data Platform

Magenta Telekom rebuilt its data infrastructure from the ground up with Dagster, cutting developer onboarding from months to a single day and eliminating the shadow IT and manual workflows that had long slowed the business down.

Scaling FinTech: How smava achieved zero downtime with Dagster
Case study

November 25, 2025

Scaling FinTech: How smava achieved zero downtime with Dagster

smava achieved zero downtime and automated the generation of over 1,000 dbt models by migrating to Dagster's, eliminating maintenance overhead and reducing developer onboarding from weeks to 15 minutes.

Zero Incidents, Maximum Velocity: How HIVED achieved 99.9% pipeline reliability with Dagster
Case study

November 18, 2025

Zero Incidents, Maximum Velocity: How HIVED achieved 99.9% pipeline reliability with Dagster

UK logistics company HIVED achieved 99.9% pipeline reliability with zero data incidents over three years by replacing cron-based workflows with Dagster's unified orchestration platform.

Modernize Your Data Platform for the Age of AI
Guide

January 15, 2026

Modernize Your Data Platform for the Age of AI

While 75% of enterprises experiment with AI, traditional data platforms are becoming the biggest bottleneck. Learn how to build a unified control plane that enables AI-driven development, reduces pipeline failures, and cuts complexity.

Download the eBook on how to scale data teams
Guide

November 5, 2025

Download the eBook on how to scale data teams

From a solo data practitioner to an enterprise-wide platform, learn how to build systems that scale with clarity, reliability, and confidence.

Download the e-book primer on how to build data platforms
Guide

February 21, 2025

Download the e-book primer on how to build data platforms

Learn the fundamental concepts to build a data platform in your organization; covering common design patterns for data ingestion and transformation, data modeling strategies, and data quality tips.