How the Dagster frontend team rapidly scaled Dagster’s DAG visualization for enterprise-sized data asset graphs.
Using Dagster at Enterprise scale
Dagster, the orchestrator for data assets, is seeing rapid adoption across industries and use cases. In the early days, a large use case might involve Asset Graphs with a couple of hundred defined assets.
Today, many Dagster users build complex, production-grade pipelines with thousands of assets. While the core Dagster engine has scaled seamlessly to meet this kind of usage, it has presented some novel challenges on the front end, namely how to deliver an excellent user experience even when the UI has to render enormous graphs.
In the following article Marco Salazar, Software Engineer on the UI team, breaks down how we sped up the rendering of massive graphs from several minutes to under five seconds.
The Dagster UI
The Dagster UI is developed using React and is the control plane for Dagster. As we’ve onboarded users with larger and larger collections of data assets we’ve invested in Dagster UI’s ability to scale. Most recently we focused on our beloved Asset Graph where each data asset is represented as a node in the graph. Our graph is rendered inside of an SVG with each node being rendered by React inside of a foreignObject allowing us to use the full capabilities of HTML/CSS inside the SVG.
Dagster Asset Graph, a representation of key data assets managed by Dagster.
The asset graph is a great tool for understanding how your assets are interrelated and for getting a quick overview of the health of your assets. But at a large enough scale, it became nearly unusable.
To boost the asset graph experience when rendering thousands of nodes we had to tackle three problems:
- Slow rendering when panning and zooming
- Timeouts when fetching data
- Slow initial render performance
Problem #1: Scrolling Lagfest
The first problem to tackle was that using the graph by panning and zooming was a miserable lag fest. To solve this problem we turned to ol’ reliable:
Virtualization is the technique of only rendering the visible elements. We knew the coordinates of all of the asset nodes and edges. All we had to do was check if they were within the bounds of our SVG viewport, and if so render them.
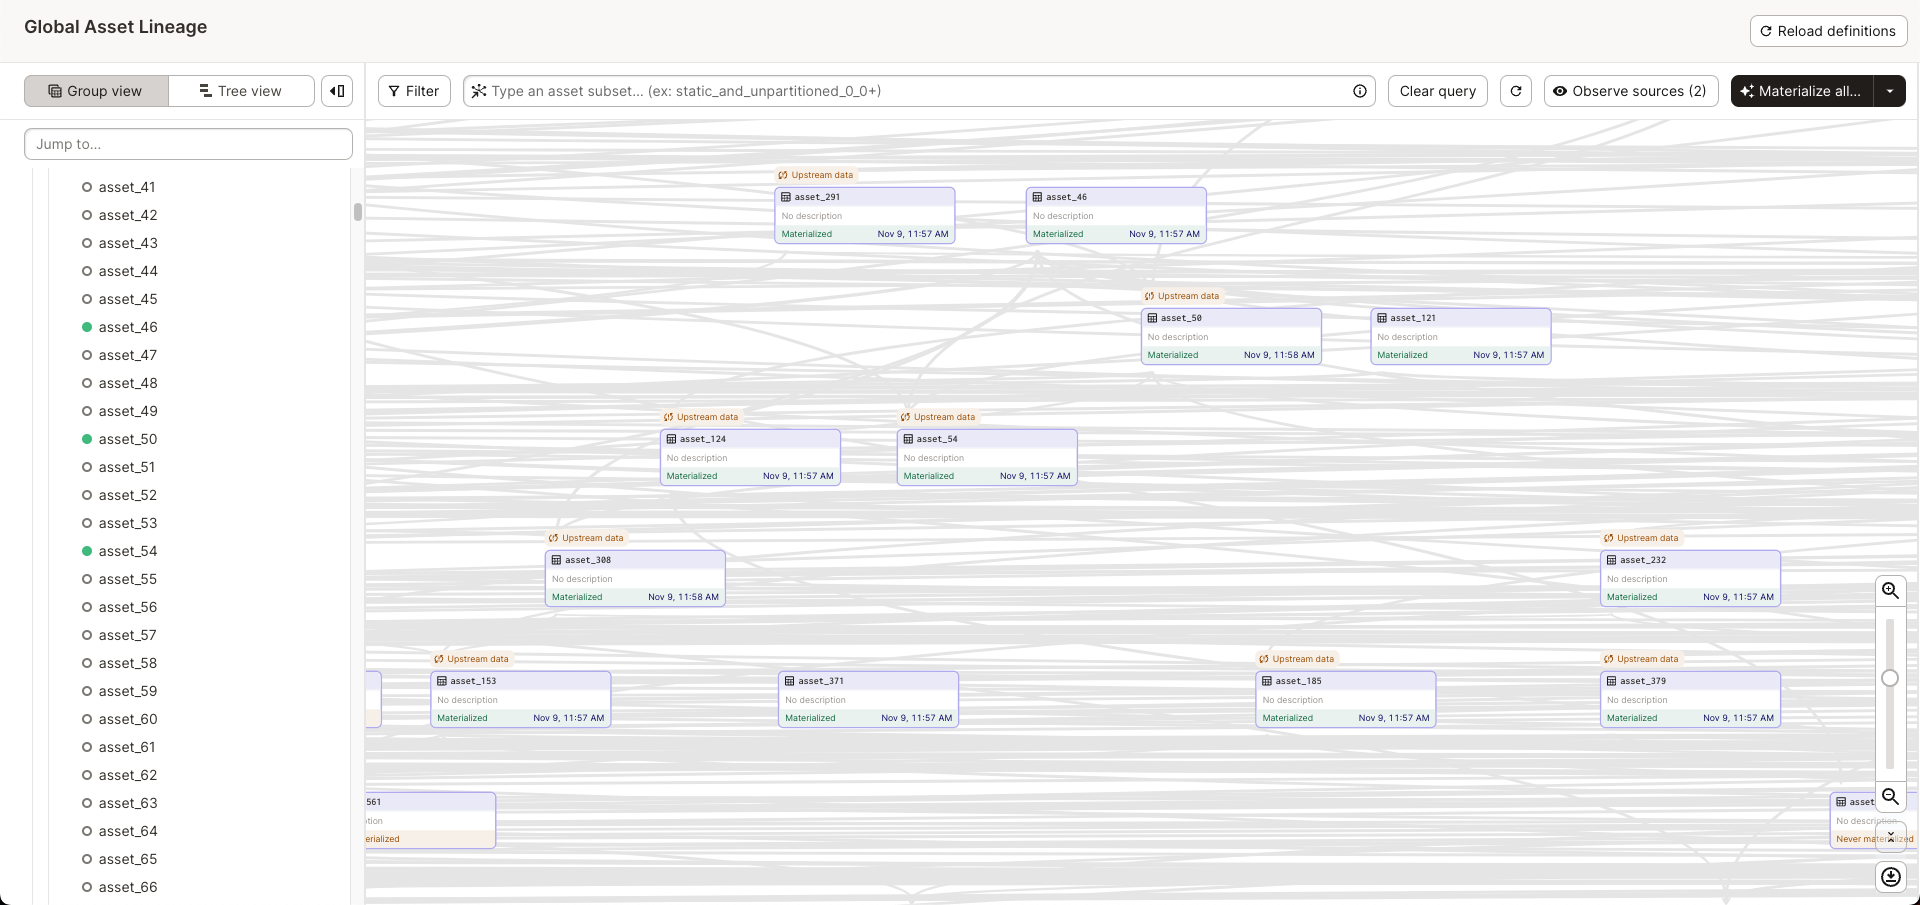
But when we implemented virtualization we did not get the result we expected: the UI was still laggy (though a lot less so)! There were too many elements visible! After some profiling, we figured out that the main culprit was all of the edges between nodes being drawn on the screen! Here is a typical example of what that looked like:

If you look closely you can see a smattering of edges going every which way. It’s very difficult to figure out where each edge is going or where it’s coming from. So we decided that if you can't see the node an edge is coming from or the node it's going to on the screen, then it's not very useful to draw it on screen. We decided to only draw an edge if its to/from node is visible on screen. This has the side effect of causing edges to appear/disappear as you pan around but we thought it was well worth the trade-off for a buttery smooth experience and to declutter the visualization. We only do this optimization if over 50 edges are being drawn on the screen at once and if the edge is not manually highlighted by the user (so that if you highlight an edge you could still pan around and follow it if you’re so inclined, though you could use arrow keys to zoom to the parent/child/sibling nodes!). Here is what the above graph looks like now:
Still a lot of edges, but much cleaner than before!
Problem #2: Loading spinners
The next problem to solve was that the nodes never left their loading state. It turns out that the graph component was fetching all of the assets in a single request which would inevitably time out. To solve this problem we moved our data fetching down to the asset nodes themselves. Now instead of 1 giant request that times out we had a bunch of granular requests that would not time out.
But what about the overhead?
One of the main drawbacks to fetching all of the data independently was increased server load and database overhead. There was also an issue where if you panned around very quickly an asset would request its data when it came into view, but then cancel the request before it completed when it left the viewport. This is a problem because canceling the request on the client doesn’t actually tell the server to stop processing the request. The server keeps chugging along unaware that the client no longer needs the request only for the work to be thrown away.
Another issue was that every time an asset entered the viewport it would issue a request, even if the cached data was still very recent. This wasn’t very likely to happen in the graph itself but we added a new sidebar that rendered asset statuses and in this view, you could easily cause this redundant call issue to happen by scrolling up and down.
Lastly, the sidebar and the graph nodes were uncoordinated meaning they made independent requests for the same data!
To solve the above problems we implemented a new class called AssetLiveDataProvider. This class did a few things:
- It kept track of which assets the UI needed data for.
- It batched the loading of asset data into chunks.
- It kept track of when an asset’s data was last fetched and made sure not to fetch it again until 45 seconds after its last fetch.
- It did not cancel requests if the UI stopped needing the data but rather stored the result in the cache in case the UI did end up needing it later.
Problem #3: Slow rendering of large asset graphs
The last performance problem to solve was the extremely slow rendering performance of large asset graphs. For our asset graph layouting we use a React library called Dagre which uses a variety of techniques to create graphs that minimize edge crossings and are as compact as possible given our visual constraints.
Caching the layout with indexedDB
A layout is the positioning and sizes of all of the nodes and edges of a graph. Before diving deeper into debugging the layout algorithm we came up with a simple bandaid: let's cache the layout so that subsequent loads of the same asset graph are extremely fast.
For caching, we opted to use indexedDB rather than localStorage because localStorage has a limit of 10MiB on all browsers whereas a layout of a thousand nodes in Dagster’s UI can easily be multiple MiB.
Also, localStorage is synchronous and blocks the main thread which would result in the UI locking up whereas indexedDB does not block the main thread, though the asynchronous nature does add a little bit of complexity to the code.
To create the keys for the indexedDB entries we hashed the inputs to the layout algorithm using the crypto.subtle API. We opted to use this API so that we wouldn't need to load a separate Md5 package. We used "SHA-1" which isn't secure (we don't need security for this hashing) and is relatively cheap. The only issue is that crypto.subtle isn't available in insecure contexts (e.g. users running the dagster UI on a development machine and accessing it via http instead of https) so as a fallback we use the unhashed inputs as the key.
Then re-caching the layout
The caching worked, but any time the graph changed (for example due to toggling visible nodes using the various filtering capabilities, or assets being renamed, added, or removed) we needed to recompute the layout and create a new cache entry. We didn't want the cache to grow infinitely so we found a nifty library called idb-lru-cache that implements an LRU cache in indexedDB. On GitHub the package isn’t actively maintained, but it’s relatively small so after a glance over the code and some tests, I was convinced it was perfect for our needs.
Speeding up the layout rendering
While the caching definitely helped, there was still the issue of the layout algorithm itself being slow. One idea was to port the library over to Rust and compile it to WASM. WASM makes everything go brrrrr right?
Wrong (but we still did it anyway, mostly out of curiosity and lack of understanding of what exactly the layout algorithm was doing). I began porting the library over to Rust using my trusty friend ChatGPT when I realized that someone had already ported Dagre to Rust, so I just used their port instead.
We still needed to port our usage of Dagre to Rust though which ChatGPT came in handy for.
Here is the rust and the corresponding JS for reference.
I set up a simple index.html file using the WASM build output and cracked open python3 -m http.server and as expected the layouting was still slow.
We realized that we were using the default “ranker” option for the library which is called “network-simplex”. This ranker results in the most visually pleasing graphs but—in the worst case—it has a complexity of O(N^3). So we switched from “network-simplex” as the default to “tight-tree” which in most cases produced the same graph!
From minutes to just a few seconds
For an asset graph with 2,000 assets, we went from minutes for the layouting, to around 5 seconds. Combined with the caching in most cases users will see the graph load instantly.
We think this is a reasonable point to stop for now. If further improvements are needed, we may explore going with a simpler layout algorithm that is more amenable to virtualization so that we don’t have to calculate the entire layout upfront.
Explore Dagster’s experimental UI features
We’re also investing in scaling the UX of our asset graph. You can take a sneak peek at some of those improvements by enabling the “Experimental asset graph experience” toggle in user settings:
Two of the big UX improvements are a new sidebar to support more easily navigating around large graphs and a new groups view with collapsible/expandable groups. Please try out the new features and drop your feedback in our github discussion.


