


Detection isn't the bottleneck anymore. Understanding is. Compass closes the loop by turning Dagster+ operational data into a conversation.
Data teams have more visibility into their pipelines than ever before. Modern orchestration and observability tools capture every run, track every asset, and surface alerts when something breaks. The promise was that all this instrumentation would finally make data platforms legible, no longer black boxes.
We have been building Dagster to help solve the “big complexity” problem with data engineering. But as platforms became more complex, the abstractions we built to address the last wave of complexity needed more support to handle the next.
The central question that a good observability and operational tool should answer is “What is even happening?” and the great ones can answer “What should I do next?”
That gap is what we set out to close with Compass.
Request access to Dagster+ Compass.
The Missing Third of the Loop
In operational analytics, there's a concept called closed-loop analytics: a cycle that captures signals, analyzes patterns, acts on findings, and measures results. The loop only works if each stage flows into the next.
We think about DataOps the same way: as a loop with three parts: Orchestrate → Observe → Act.
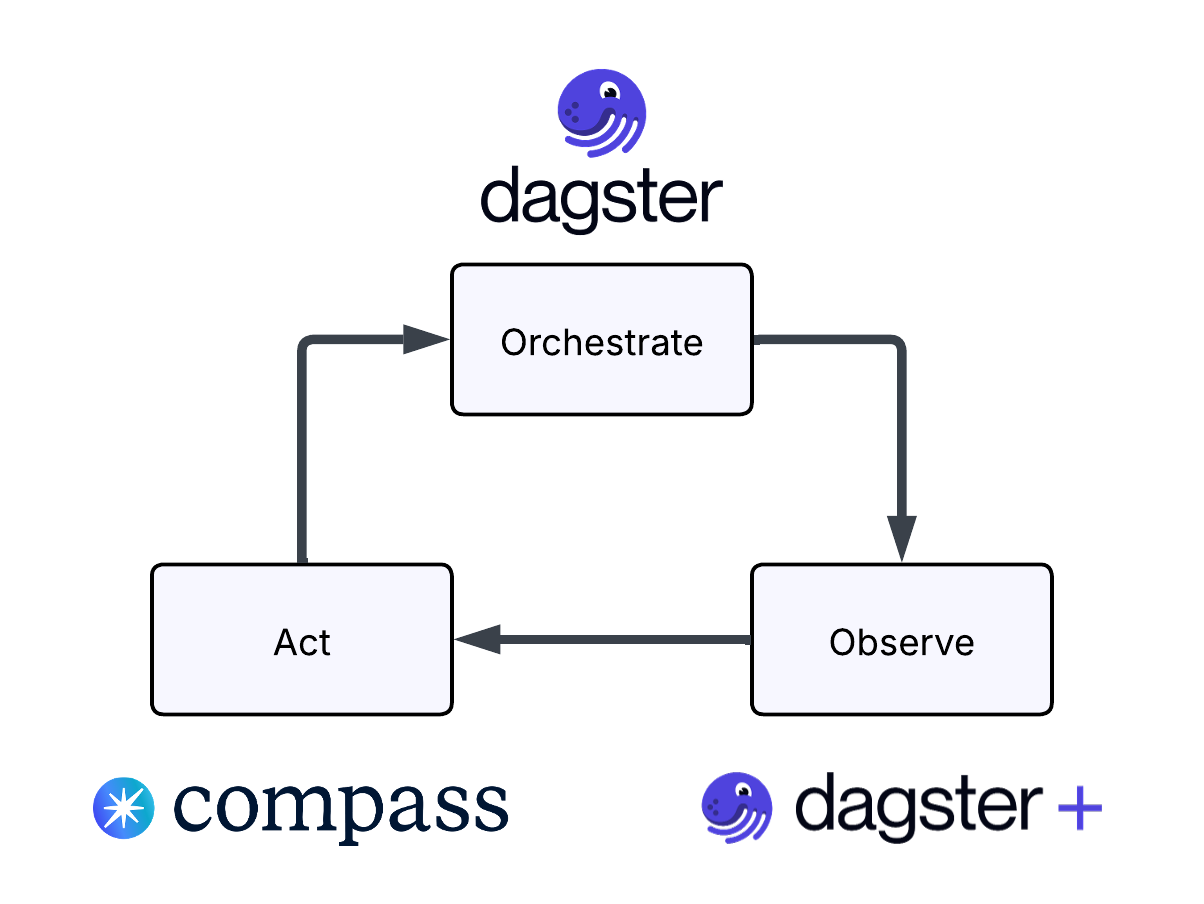
Dagster+ handles orchestration. You define your assets, set up schedules and sensors, and Dagster makes sure your pipelines run when and how they should.
Dagster+ also handles observation. Every run is tracked. Every asset has lineage. You can see what succeeded, what failed, what's stale, and what depends on what. The metadata is rich, and it's all there.
But the third part, acting on what you observe, has historically been left as an exercise for the reader. You have the signals. Now go figure out what they mean, decide which ones matter, and determine what to do next.
This is where the observability industry has focused on Mean Time to Detection and made real progress. But detection isn't resolution. Teams still struggle with Mean Time to Resolution because turning an alert into understanding requires manual investigation: opening the right views, filtering to the right time window, cross-referencing across jobs, and pattern-matching in your head.
Compass closes this loop. It turns Dagster+ operational data into a conversation, so you can go from "something seems wrong" to "here's what's happening and what to do next" without leaving Slack.
What the Dagster+ Compass Integration Actually Does
Compass is an AI agent that now understands your Dagster+ environment. You can ask it questions in natural language, and it responds with answers grounded in your actual runs, assets, and metadata.
Compass is designed to guide investigation, not just answer one-off questions. It suggests where to drill down next. It surfaces patterns you might not have thought to look for. It provides links to the exact locations in Dagster+ where you can take action.
A typical investigation might start broadly: "Give me a summary of my data platform's health." Compass responds with a breakdown of successful vs. failed runs across your common jobs, success rates by code location, and top and bottom performers over the last seven days.
From there, you can pull on any thread. Drill into failure time distribution, and Compass shows you rates by day and hour, highlighting spikes worth investigating. Ask what failed on a specific date, and it identifies the culprits, maybe one job that failed repeatedly, plus a few scattered others.
At each step, Compass suggests next moves: compare across days, examine dependencies, drill into specific runs. The conversation builds on itself, guiding you toward root causes rather than leaving you to figure out what to click next.
Our own data team has been using Compass to monitor the Dagster platform at a deeper level. Nick Roach, one of our data engineers, put it well: "I want a one-stop shop when I'm investigating what might be going wrong. Being able to interact conversationally—and have it suggest where to go next—is really exciting."
From Firefighting to Pattern-Driven Improvement
The obvious use case for Compass is incident triage. Something breaks, you ask Compass what happened, and you get an answer faster than you would have otherwise. That alone reduces time to resolution.
But the more interesting use case is what happens when you're not firefighting.
One of the hardest problems in operational analytics is what Monte Carlo calls "unknown unknowns" issues that don't trigger alerts because you didn't know to test for them. You can have comprehensive monitoring covering anticipated failure modes, but still miss the slow degradations, the creeping runtimes, the flaky jobs that fail just often enough to be annoying but not often enough to become a priority.
Because Compass can analyze patterns over time, it becomes a tool for surfacing these unknown unknowns. Which jobs are flakiest? Which sensors are taking longer than usual? Where are you burning retries? What's the long tail of failures that never quite rise to the level of an incident but quietly erode reliability?
These are the questions that teams rarely have time to investigate because there's always something more urgent. But they're exactly the questions that compound over time. Fix the flakiest job, and you eliminate a whole category of noise. Identify the sensor that's been slowly degrading, and you catch the incident before it happens.
Compass makes these investigations lightweight enough that you can actually do them. Ask a question, get an answer, follow the thread. No need to build a dashboard or write a query, just have a conversation.
Why Slack?
The industry is coalescing around the notion that data must be embedded in the applications your organization uses every day. Analytics that require context-switching get ignored when things are busy, which is exactly when they matter most.
We built Compass for Slack first (with Microsoft Teams and Discord coming soon) because that's where data teams already coordinate. When something breaks, the first question usually gets asked in Slack. The triage happens in Slack. The "can someone check on this?" pings happen in Slack.
By embedding operational intelligence where teams already work, Compass reduces the friction between noticing a problem and understanding it. You don't have to context-switch to another tool. You don't have to remember which dashboard has the view you need. You just ask.
It also makes collaboration seamless. When you get an answer from Compass, you can share it directly in the channel. Your teammates see the same context you do. The investigation becomes a shared artifact, not something locked in one person's browser tabs.
What's Next
This launch is the foundation for something bigger.
Data platform visibility has always been fragmented. Orchestration tools show runs and schedules. Observability tools monitor data quality. BI tools surface what's in the data. Understanding the full picture has meant stitching together multiple tools and mental models.
Compass changes that. Because it's built on Dagster+, it has access to the full context: what jobs ran, what assets they produced, what dependencies they relied on, and how it all connects. Over time, we'll extend this to include the data itself, so you can move from "this job failed" to "here's what changed in the output" to "here's the downstream impact."
We also plan to expand into more agentic workflows: creating tickets, suggesting code changes, and eventually assisting with pipeline authoring. But that depends on trust, which is why we started here, with a conversational interface grounded in Dagster+ reality.
Observability tools have solved detection. Compass closes the loop by solving understanding.
See it in action: Join us for Running Dagster: How We Use Compass for AI Analytics to see how our team uses Compass on our own platform.
If you are an existing Dagster+ Customer and want access to Dagster+ data through Compass, request access here


.jpg)
.png)

.png)

