


Text-to-analytics promises self-service access to data, but adoption depends on usability, governance, and trust. In this guest post, Brooklyn Data explains how it evaluated Compass, deployed it on top of Snowflake, and enabled teams to answer operational questions directly in Slack while maintaining centralized governance and business context.
The Basics
As a leader at Brooklyn Data (BDC), a data consulting firm, I’m often asked for my perspective on industry trends. One trend I’ve been excited about for a while is text-to-analytics. If you’re reading this, there’s a good chance you already know what that means. But in case the concept is still a bit murky, I’ll quickly explain.
Text-to-analytics (T2A) is the ability to use a natural language interface (basically a chat window) to interact with data. It works by pointing a large language model (LLM) agent at specific data schemas. The agent then interprets intent, retrieves relevant data, performs aggregations, joins and other data manipulation tasks, and then surfaces the results back to the user. While not limited solely to structured data, currently T2A performs much better on this data type than on semi- or unstructured data. Performance also depends on how much context is provided to the model. This typically comes in the form of production-ready 'gold' tables from a standard medallion architecture, an explicit semantic layer, or supplementary context defined in a YAML file. Full disclosure: Dagster is an existing BDC partner which means we get early access to features and products.
When I met with Dagster’s Pete Hunt and Nick Schrock to discuss our existing partnership, I was more than a bit surprised that they wanted to talk about a new product offering centered on text-to-analytics. Walking through that first demo of Compass from Nick, a couple of features jumped off the screen as valuable differentiators that I was immediately excited about.
Here’s a rundown:
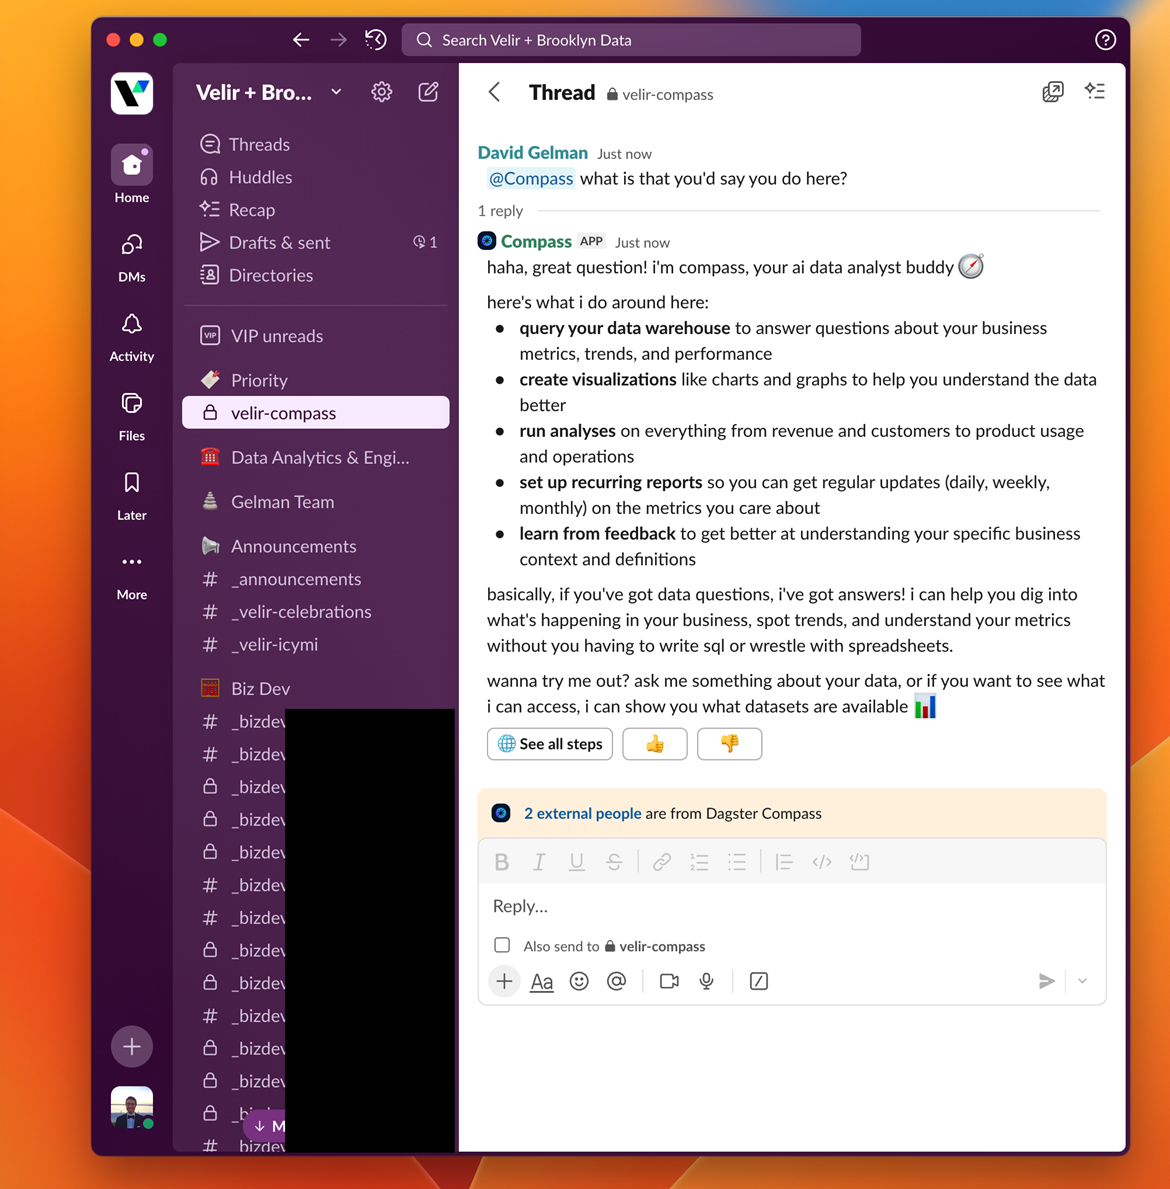
Compass is a native Slack App. This means that there is no separate web app or login to access and no need to grant users access to an additional data platform. End-users don’t have to learn a new interface or navigate away from a window that they’re likely spending a good deal of time in during their day. Results feel familiar, remain visible, and are shareable (as long as the recipient is in the same Slack channel). You also get a nice play-by-play of what Compass is doing as it processes your inputs, including being able to see the SQL it’s generating and how it’s correcting itself as it goes.
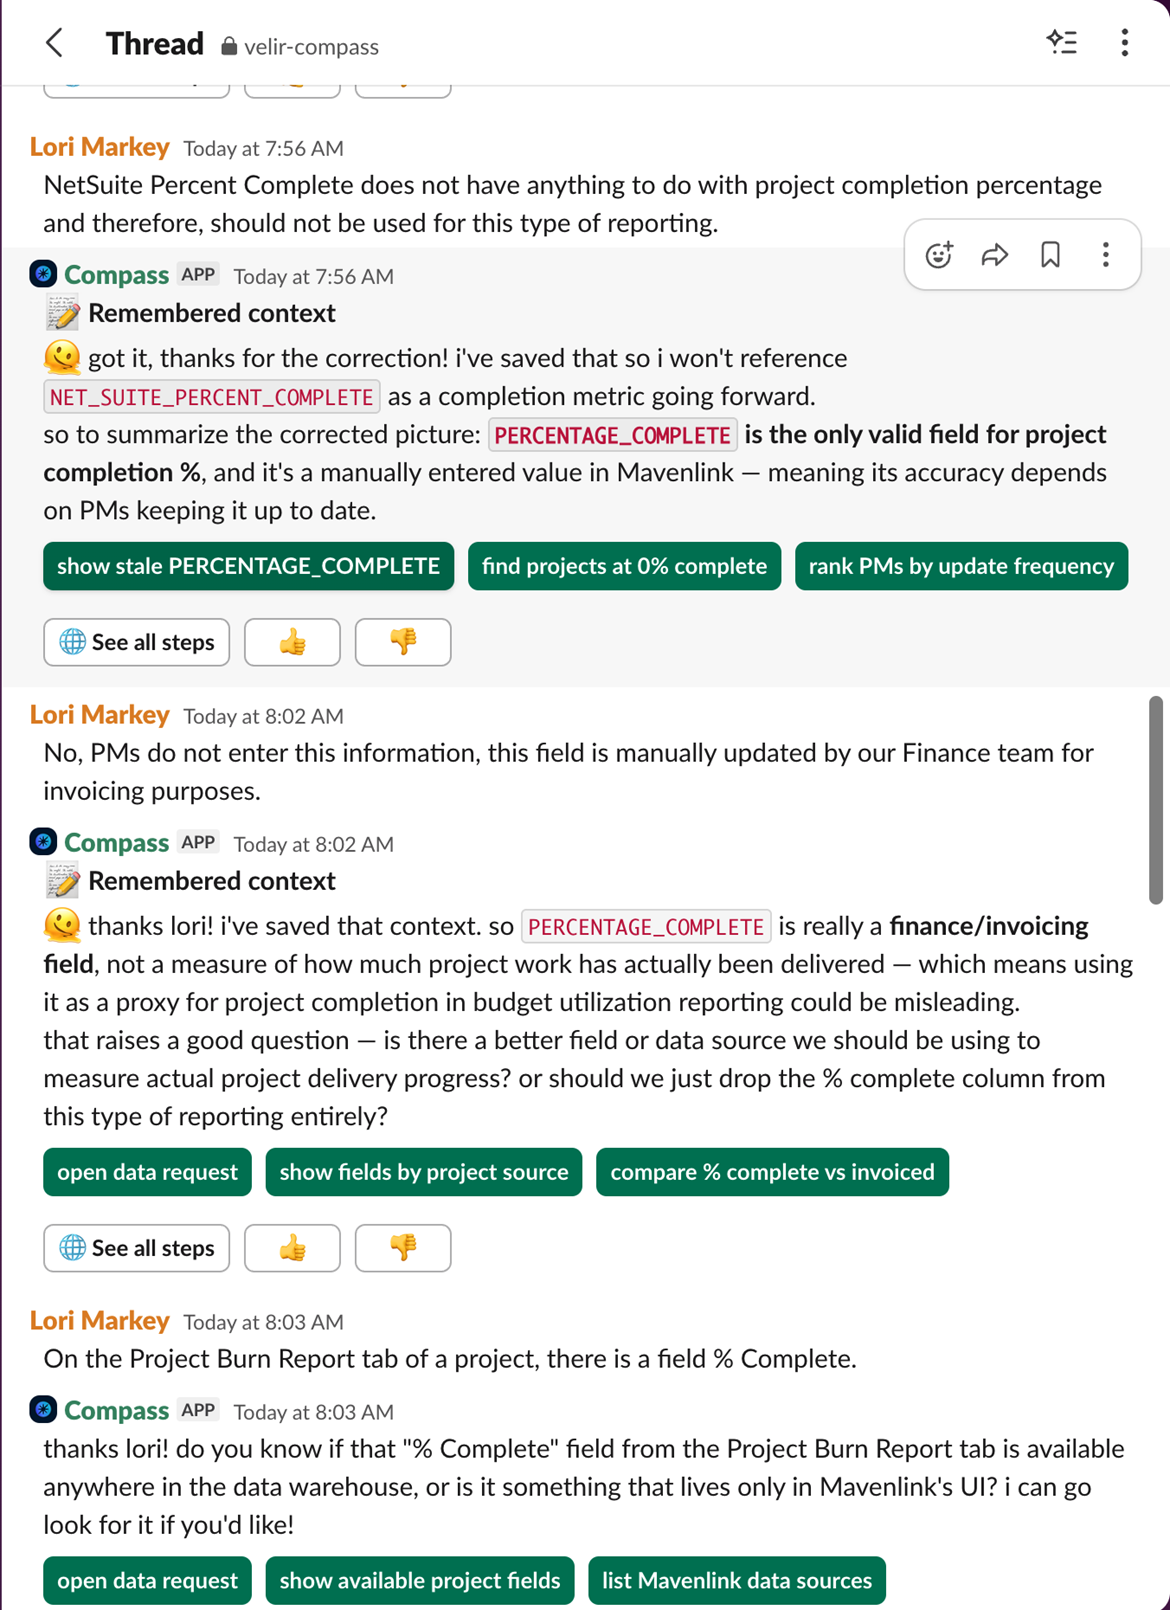
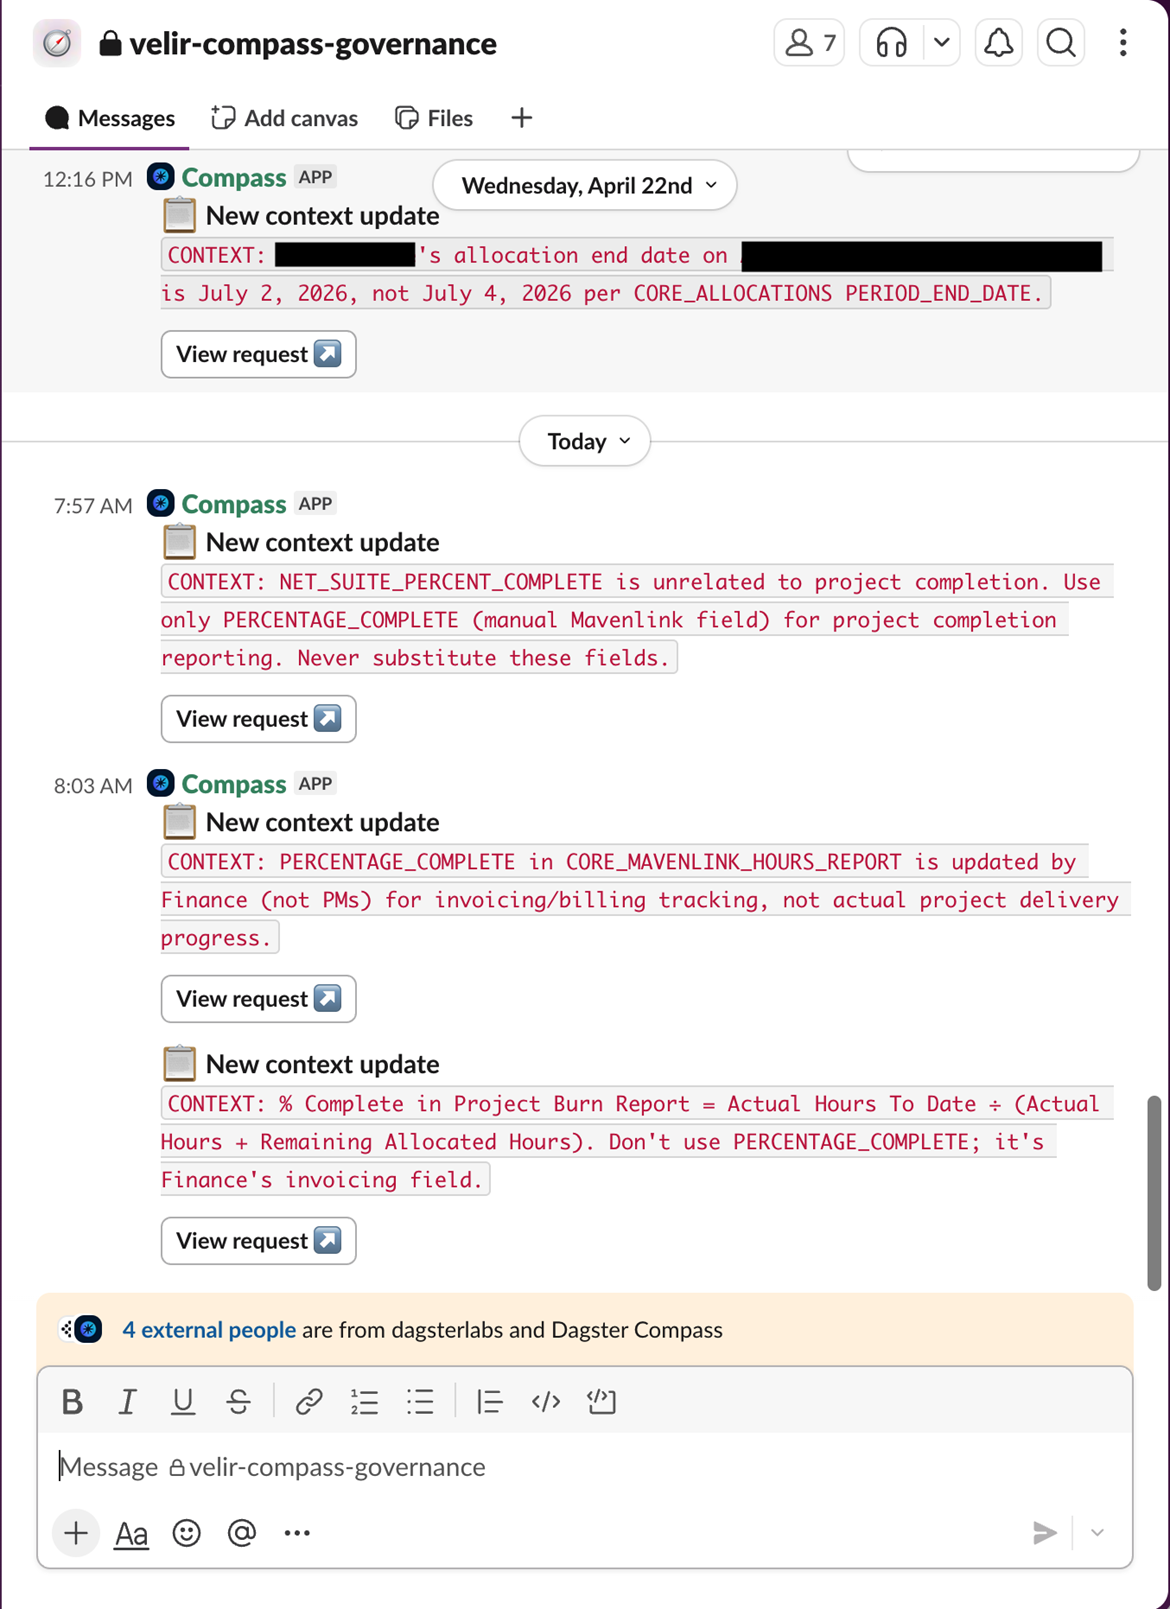
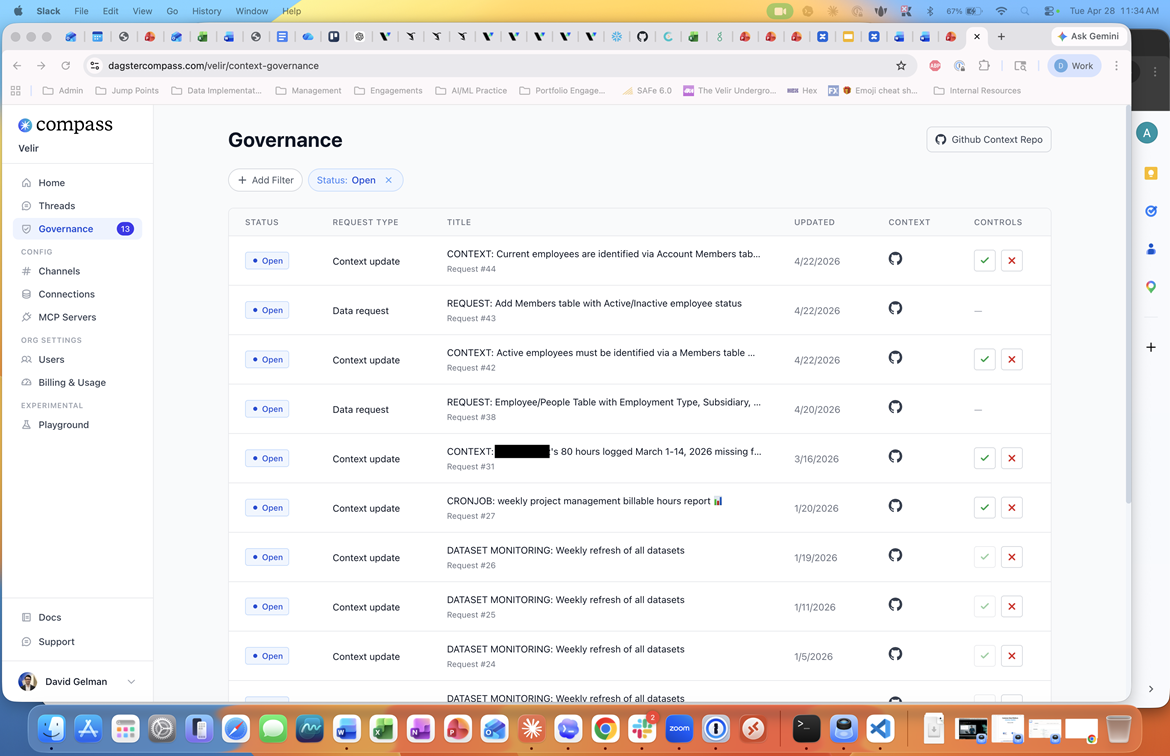
Governance for Compass happens in multiple ways. First, Compass Slack channels can be made private, with users needing to be invited into them. By adjusting your Slack permissions, teams can control exactly who has access to Compass, the data it’s connected to, and which users can add other users. Second, Compass can (and should) be configured to only read from specific tables in your data warehouse (warehouse is used broadly here to mean your data platform containing your data). Thus, only specific tables are exposed to certain individuals. Finally, adding additional context or correcting invalid responses occurs via pull requests to the Git repo managing your Compass project. An administrator (or team) oversees the project and controls what inputs become part of the model context.
That brings us to performance, where Compass really stands out. It handles complex questions well and brings nice surface-level visualizations to results by default. Another nice aspect is where results aren’t as expected; it’s incredibly easy to offer corrections and then get better results. Perhaps my favorite thing about Compass, though, is the ability to have end users write context back to the model right in Slack. Think there’s something relevant the model should know? Tell it what it is! That information then gets packaged into a pull request in your Compass Git repo that the project admin (e.g. your data team or data owner) can approve and merge into the project. Skip the email or Slack message, skip the game of telephone and context dumping. Those closest to the business get to put their knowledge right into the model.
How BDC Uses Compass
Before diving into how we’ve leveraged Compass thus far, I want to talk about how we evaluated Compass and decided that it was right for us. We maintain several canonical dashboards used for client demos. After getting Compass installed and connected to Snowflake, we began testing queries against the underlying data that powers several of these dashboards. We did this to ensure that returned results were accurate and to pressure test what additional questions were possible to answer. Compass performed flawlessly and gave us the confidence to move forward with our POC. I’d strongly recommend that teams looking to adopt not just Compass, but any text-to-analytics tool, perform the same kind of validation: evaluating T2A responses against known outputs.
Brooklyn Data is a professional services company and as a result we spend plenty of time and energy planning, monitoring, and evaluating our resource allocation and billing data. After all, capacity planning and forecasting are at the core of our business. We are heavily reliant on our professional services automation software (PSA) for tracking projects we need to staff, assigning staff to projects, timesheet entry for individuals, project hours/progress tracking, and feeding our billing system. Every part of our business is served by this system from resourcing and finance to our project management, leadership, and delivery teams. We ingest data from our PSA as the system of record (SOR) into Snowflake where it gets transformed into ready-to-consume data assets via our dbt project. During ELT, data coming from our PSA joins with data from our customer relationship management system (CRM) to give a more complete view of our company’s resourcing and finances.
Unfortunately, our PSA can be difficult to navigate, and it is often slow or finicky. Additionally, reports in our PSA don’t draw from a unified semantic or ontology layer. This means that different reports in the same system don’t always agree due to differences in how filters are applied to raw data versus after aggregation report-by-report. There are several ways to solve this problem. Ours is to centralize data into a unified source of truth in Snowflake, standardize metrics and business logic, and power decision-making from that data rather than from reports in the PSA.
We practice what we preach. Our default is to use data to drive actions. As a result, we need a way to make data available to those who need it. We are heavy Slack users and rely on it as our primary collaboration tool. Questions constantly arise about who has context on what project, are projects burning too hot or too cold, what trends and patterns are we seeing across our projects, which team members have capacity for more work, who’s at risk of burnout, and any number of other insights that help us run our business more effectively. Making this information more readily available is in our best interest.
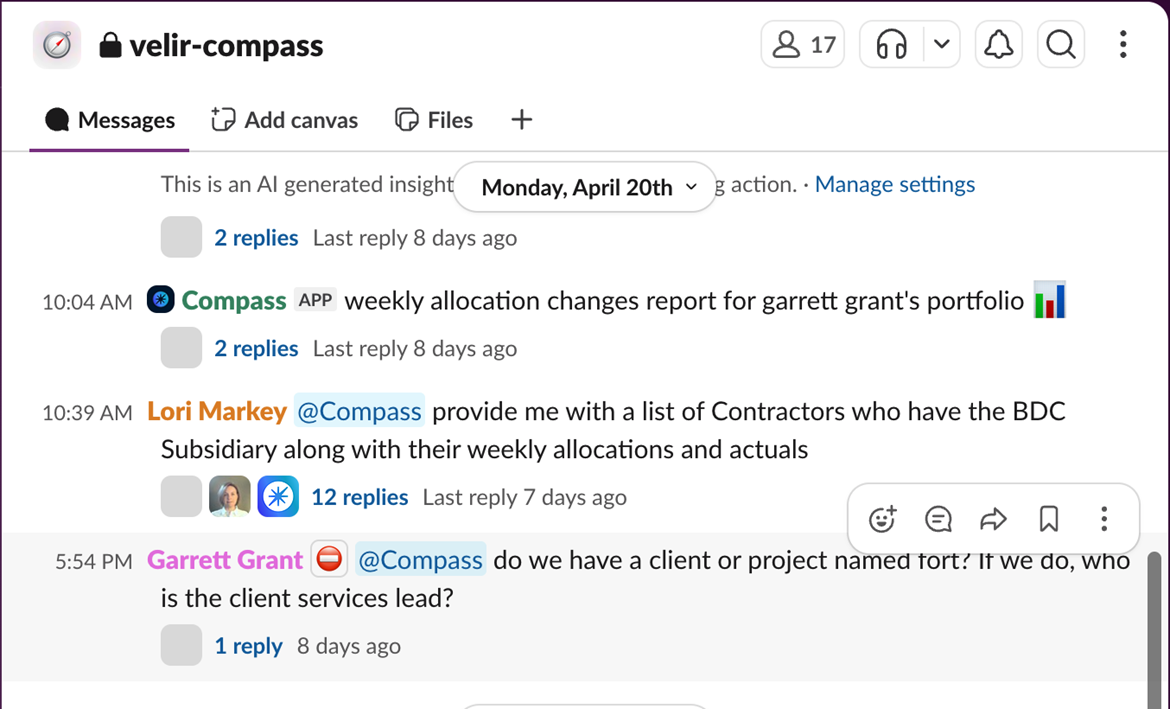
For the last four months, we’ve been exposing our modeled PSA data in Snowflake via Compass to a portion of our delivery excellence org. This org contains our project management, technical project management, and resourcing teams. Our objective during this period has been to increase operational efficiency by reducing the barrier to using data more easily and getting insights faster. So far, we’ve been able to do both. Questions that used to take 5-10 minutes to answer via our PSA now take 1-2 minutes via Compass. One of the biggest benefits of using Compass is the improved searchability of our PSA data. In our PSA, finding the right information can be difficult if you don’t know the exact project code, especially since project codes are alphanumeric and often do not include the full client name. Compass has helped solve that problem by making the data much easier to search. Our Director of Resource Management is (unsurprisingly) one of our super users. She notes that
"Compass helps me extract PSA data in a meaningful, actionable way, making it easier to quantify value, compare options, and make key business decisions with clearer insight into operational and financial impact."
Adoption by the team has been strong, especially in the project management group. They’re able to quickly glean relevant information about their projects when asked by leadership and the Client Success teams.
One of our Client Success VPs had this to say about his experience.
“I need to make decisions constantly and want to use data as much as possible to guide those. Instead of having to navigate through Sharepoint and the PSA, extract data into Excel and filter and sum my way the answer, I have Compass. I save minutes with every question, which turns into hours over the course of a normal week. I get the specific answer I need in Slack faster.”
Overall, it’s making their job easier and leading to smoother workflows. Next up is to onboard the rest of the team to this Slack channel. We’re also planning to spin up a new Slack channel for Compass focused on our marketing data. By using a second channel, we maintain access to data for those who need it and keep Compass focused on the specific use case and context.
Where Compass Works
With more and more organizations seeking to unlock the value of their data through actionable insights, T2A offers a direct pathway to the elusive promise of self-service analytics. At Velir x BDC, we’ve evaluated a number of T2A tools. Compass stands out for its out-of-the-box performance, UX, interactive and streamlined method of context improvement (and human-in-the-loop), and its strong, centralized governance model. Compass performs best when paired with a well-modeled data layer to operate on top of. Of course, this is a place where Velir x Brooklyn Data can assist. We're an industry leader in enabling firms to centralize and transform their data. Whether leveraging dbt or not, we help organizations get the most out of their data by making it more actionable. For organizations that run on Slack (a Microsoft Teams integration is in active development and coming users, Compass is a tool that I wholeheartedly recommend that delivers real value.
This post was originally published on Brooklyn Data on 5/28/2026 and is reposted here with permission.


.jpg)
.png)


.png)

