A technical deep dive into the patterns and implementations of the Dagster Open Platform using our open-sourced code and dbt models.
Dagster Open Platform (DOP) is a complex and at-scale Dagster project, available as an open-source, public repository for others to reference and use as inspiration. It applies best practices in data engineering and Dagster to build complex asset-based pipelines. Dagster Open Platform was first announced at last month's jam-packaged launch week, but merits a highlight of its own.
This project is what runs the Dagster Labs business. Dagster Open Platform contains parts of our data platform, so you can see how the Dagster Labs team uses Dagster itself. We use Dagster's most up-to-date best practices and APIs to practice what we preach. DOP is a valuable resource for Dagster users, growing data teams, and SaaS startups looking to build a reliable data platform of their own.
In this post, we'll take a technical deep dive into the patterns and implementations of our own Dagster project. All of the code snippets seen in this post are from the Dagster Open Platform repository.
Guidance for after Day 1
Dagster is an open-source Python framework for orchestrating data pipelines. By definition, a framework is a reusable set of classes and functions that provide generic functionality and allow developers to insert their code into specific places to customize the framework for their specific use case.
Being composable, there are lots of ways to do things in Dagster. Sometimes, our users have questions about the "right" thing to do. Throughout 2023, we've focused on defining the recommended way to use Dagster and what's essential to take Dagster to production for the first time. For example, we've released Dagster University(which had over a thousand students in its first month!) and have been more intentional and user-focused than ever about our documentation.
But there is still a gap left once you've deployed Dagster into production. This is why we open-sourced Dagster Open Platform: to serve as a reference in the next steps of your Dagster journey. DOP contains the decisions we made for our data platform, providing your context and guidance on using Dagster not only on Day 1 but also on Day 180 and Day 365.
Diving deep

We recently open-sourced the code and dbt models we use to transform and analyze our open-source project's telemetry data. This blog will cover some of this, the utilities, and patterns that make up the DOP repository.
These are the patterns that we implemented and that work for our use cases. However, what works for us may not work for you. There will be decisions we'll revisit as we scale, but you'll still get value as I explain why we decided to implement the way we did and the tradeoffs involved.
Working across environments
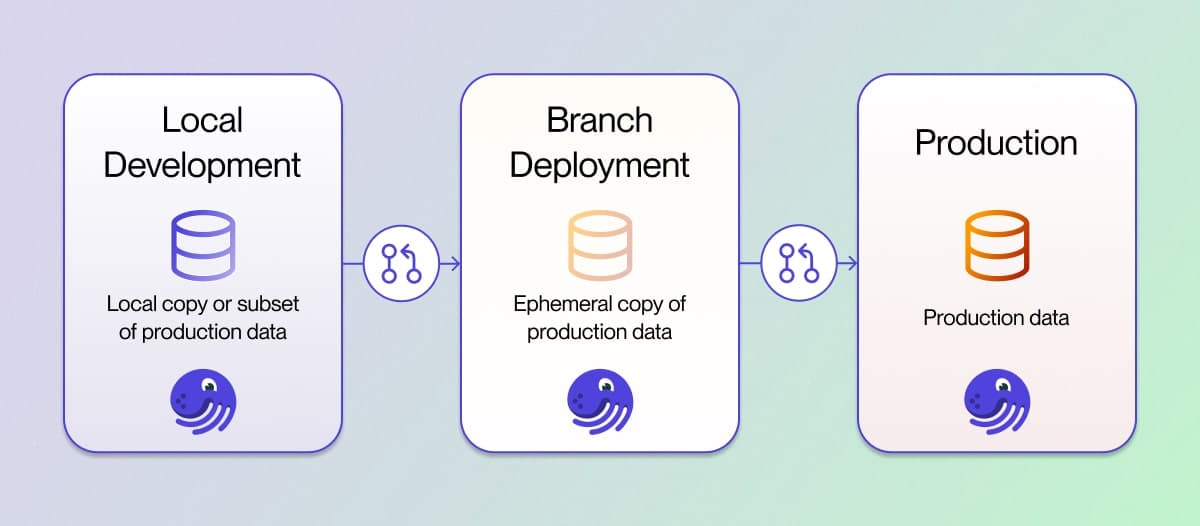
Dagster can be run in multiple ways. For example, many users develop pipelines locally with the dagster dev CLI command. Some teams may run unit tests and programmatically build their assets with the materialize function. Afterward, they'll raise a PR with their changes and test pipelines in a close-to-production setting with Dagster Cloud's branch deployments. Finally, the PR gets merged, and the pipeline is running in production.

In each of these scenarios, Dagster is running in a different environment, and each environment has its nuances.
- When developing locally, a developer is working on their own copy or subset of the data
- In the PR process, they want to materialize their assets to a temporary destination that gets deleted after the PR gets merged.
- In production, the pipelines should run with all historical data and react to new data coming in
In addition, unit tests can be run locally or in CI.
At Dagster Labs, we've found ourselves constantly writing logic to decide what database or S3 bucket to read and write from. This is why we have a set of helpers that not only figure out which environment Dagster is currently running in, but also what to do if in a specific environment.
In the Dagster Open Platform repository, a module called utils contains a few files, notably one called environment_helpers.py. We'll start this deep dive by looking at the heart of our utility:
def get_environment() -> str:
    if os.getenv("DAGSTER_CLOUD_IS_BRANCH_DEPLOYMENT", "") == "1":
        return "BRANCH"
    if os.getenv("DAGSTER_CLOUD_DEPLOYMENT_NAME", "") == "prod":
        return "PROD"
    return "LOCAL"
This leverages a few environment variables that Dagster Cloud sets:
- When
DAGSTER_CLOUD_IS_BRANCH_DEPLOYMENTis set, our Dagster deployment can safely assume that it's running within a Branch Deployment. We'll talk about how we optimize our pipelines and development process with this knowledge later. DAGSTER_CLOUD_DEPLOYMENT_NAMEmaps to the name of the environment you've defined for your Dagster Cloud deployment. Dagster Cloud users can have multiple deployments, so this can vary depending on how many you have. However, the Dagster Labs data team only has one we depend on, calledprod, and we check for that.
Otherwise, we assume you're running locally or running unit tests.
Using this method as the foundation for all of our environment helpers, we use those constants to define other helper methods that allow us to resolve what database to write to, what schema to write to, or what context the dbt project is running in.
During development, every engineer at Dagster Labs gets their own schema within a database called SANDBOX. Each schema is named after the person working within the schema. In my case, my dedicated schema is named TIM.
Where things get interesting is when a PR is raised. For each new PR, we automatically make a zero-copy clone of our production databases and name that clone based on the PR number, such as PR #1523 would have its own database called PURINA_CLONE_1523. When running pipelines within a Branch Deployment, the assets materialized will pull data from the zero-copy clones and write new data into that PURINA_CLONE_1523 database. When the PR gets merged, the database is deleted.
You may catch some references to a certain pet treat company in our repository. That's because we believe in dogfooding, and we use our internal analytics platform to dogfood our product.
Dissecting dbt
dbt is the most popular tool that people use Dagster with. We've invested heavily into our dbt integration, and can confidently say that Dagster is the best way to run dbt in production.
Recently, we open-sourced the dbt models related to our open-source telemetry models. We've also published the staging models for our cloud telemetry.
Matching dbt sources to their asset keys
If you're familiar with our dbt integration, you may use the @dbt_assets decorator and its companion DagsterDbtTranslator class. We configure our DagsterDbtTranslator to define the asset keys and map our dbt sources to upstream models. Asset keys typically convey the physical location of where the asset is stored. In the code snippet below, we set the asset key based on the namespace of the source.
def get_asset_key(cls, dbt_resource_props: Mapping[str, Any]) -> AssetKey:
	resource_type = dbt_resource_props["resource_type"]
	resource_name = dbt_resource_props["name"]

	... # Other logic

	if resource_type == "source":
		database_name = dbt_resource_props["database"].lower()
		schema_name = dbt_resource_props["schema"].lower()
		return AssetKey([database_name, schema_name, resource_name])
With this method, the source table of purina.prod_telemetry.oss_telemetry_events_raw would resolve to an asset key of ["purina", "prod_telemetry", "oss_telemetry_events_raw"]:
sources:
  - name: prod_telemetry
    database: purina
    schema: prod_telemetry
    tables:
      - name: oss_telemetry_events_raw
By following the convention that the asset key should match where the asset is stored, our dbt sources will always match up with their respective assets.
Enriching dbt's metadata
In the translator, we also define metadata for each model. In Dagster, there are two points where metadata can be added to an asset: static data can be added when an asset is defined and dynamic data is computed at every materialization. When each dbt model is defined in DOP, we attach a link to the table made in the Snowflake UI. By making the link readily available, developers and stakeholders can quickly navigate to the table in the Snowflake UI. Below is the override for get_metadata we use to create this link.
def get_metadata(cls, dbt_node_info: Mapping[str, Any]) -> Mapping[str, Any]:
	if dbt_node_info["resource_type"] != "model":
		return {}

	return {
		"url": MetadataValue.url(
			f"{SNOWFLAKE_URL}/{dbt_node_info['schema'].upper()}/table/{dbt_node_info['name'].upper()}"
		)
	}
You can find the complete code for our DagsterDbtTranslator implementation at dagster_open_platform/utils/dbt.py.
Defining our dbt related objects
We define our dbt-related objects in a few different places. We construct our translator in the utils directory because it's commonly used, and we instantiate our DbtCliResource with the rest of our resources. We define a separate set of @dbt_assets for each pipeline we have and leverage dbt's source:<source_name>+ selector to decide which dbt models should be grouped together. This isn't necessary in some ways, as Dagster can dynamically resolve what dbt models to run. However, this tradeoff allows us to group our dbt assets semantically and partition dbt models with the same partition definitions as their ingestion and reporting.
Bridging dbt across environments
We can combine our understanding of working across environments (as described earlier) and pass it to our dbt project. One of our environment helper methods is get_dbt_target, which we use when building and running the dbt project. When in local development or a Branch Deployment, we limit the amount of data used in development to a short window of data, such as the past 90 days.
Conclusion
Dagster Open Platform is still in its early stages. We will continue sharing our more complex pipelines and end-to-end solutions with the open-source data community. If you're interested in keeping up-to-date and learning more about how we build out our own analytics, give the Dagster Open Platform repository a star ⭐!


.jpg)
.png)
.jpg)


.png)

