


How Dagster+ Insights helps you control costs and elevate your data platform’s observability.
Most company’s data platforms are large, complex, and mission-critical. They integrate dozens of systems and serve hundreds of stakeholders. Understanding the health of the data platform as it grows is difficult.
Getting key information — like how reliable the data is, and how much each asset costs to build — requires jumping between multiple tools. Even worse, implementing those tools requires multi-quarter integration projects. In short, engineering leaders lack a single pane of glass for understanding the state and cost of their data platform.
Today, we are launching that single pane of glass for operational observability: Dagster+ Insights. With Dagster+ Insights, both data platform owners and individual practitioners can see both the forest and the trees of their data platform. That is, they can understand the quality, timeliness, and cost of their entire data platform, and they can zoom in to understand the exact performance of each asset.
Dagster+ Insights empowers individual practitioners to see the impact their pipeline has on the whole platform, and it enables data platform owners to understand the overall health and spend of their data platform.
The Trees: A Practitioner’s Story
Let’s say you've crafted a pipeline that runs flawlessly on your local machine. It's passed all tests in a branch deployment and is now live in production. Rinse, wash, repeat, and six months later, you’ve got over 200 pipelines.
The complexity has multiplied, and so has the potential for silent failures and inefficiencies. As a result, trying to keep tabs on the quality of your pipelines is difficult, and you aren’t sure what the financial impact of your pipelines is, especially over time.
The Forest: A Platform Owner’s Story
Now let’s say you administer your company’s data platform. You are responsible for the data team’s SaaS bills, and lately, they’ve been going up.
You flip between different tools, matching up execution metadata from your orchestration system with cost data from your data warehouse. This connection is crucial for understanding the cost-effectiveness of your data operations. After a while, you figure out which tables are primarily responsible for the increase in costs, but it’s still hard to know which team to talk to or the knock-on impact of modifying the pipeline.
These scenarios aren’t hypothetical; they are the reality for many data teams today.
The Orchestrator as Your Lookout
At Dagster Labs, we believe the orchestrator is the right tool for building this kind of observability, rather than a dedicated point solution that sits outside your pipelines’ execution flow.
Here’s why:
- All the operational data is in one place, so you no longer have to jump between tools to get a complete picture of the platform’s health.
- By surfacing the real cost of computation in the orchestrator, individual practitioners can become more sensitive to their impact on the bottom line.
- You can zoom in at the asset, asset group, or asset owner level, which are natural ways to explore your pipelines. Whether you are a practitioner, platform owner, or a stakeholder, you can quickly pinpoint areas of operational improvement.
- And you get all this bundled in Dagster+, with no data integration or syncing needed. You’ve already done the work of identifying which assets to track by setting up your data platform on Dagster. Insights is building on the strong foundation of what is already there.
How Dagster+ Insights Reshapes your Thinking
Introduced experimentally last October, Dagster+ Insights has already begun reshaping how our users perceive their data platforms. Let’s look at some practical use cases that demonstrate the power of what we’ve launched with Dagster+ Insights.
Use Case 1: Optimizing Fivetran Costs
Fivetran is a very popular data ingestion SaaS solution. While it makes it very easy to get ELT pipelines set up by ingesting data from a wide range of sources, many companies that adopt Fivetran find themselves facing a recurring — and expanding — usage bill every month.
Consider a scenario where you are replicating data from Postgres into Bigquery. Over time, the number of rows you are ingesting is increasing, as is your bill.
With Dagster+ Insights, you’re able to look at the global level to see which assets and processes might be the most costly.
Once you’ve pinpointed the areas where an alternative to Fivetran would save you a lot of money, check out our blog on using embedded elt and see how our integrations with Sling or dlt can help you reduce your spend.
Use Case 2: BigQuery Spend Awareness
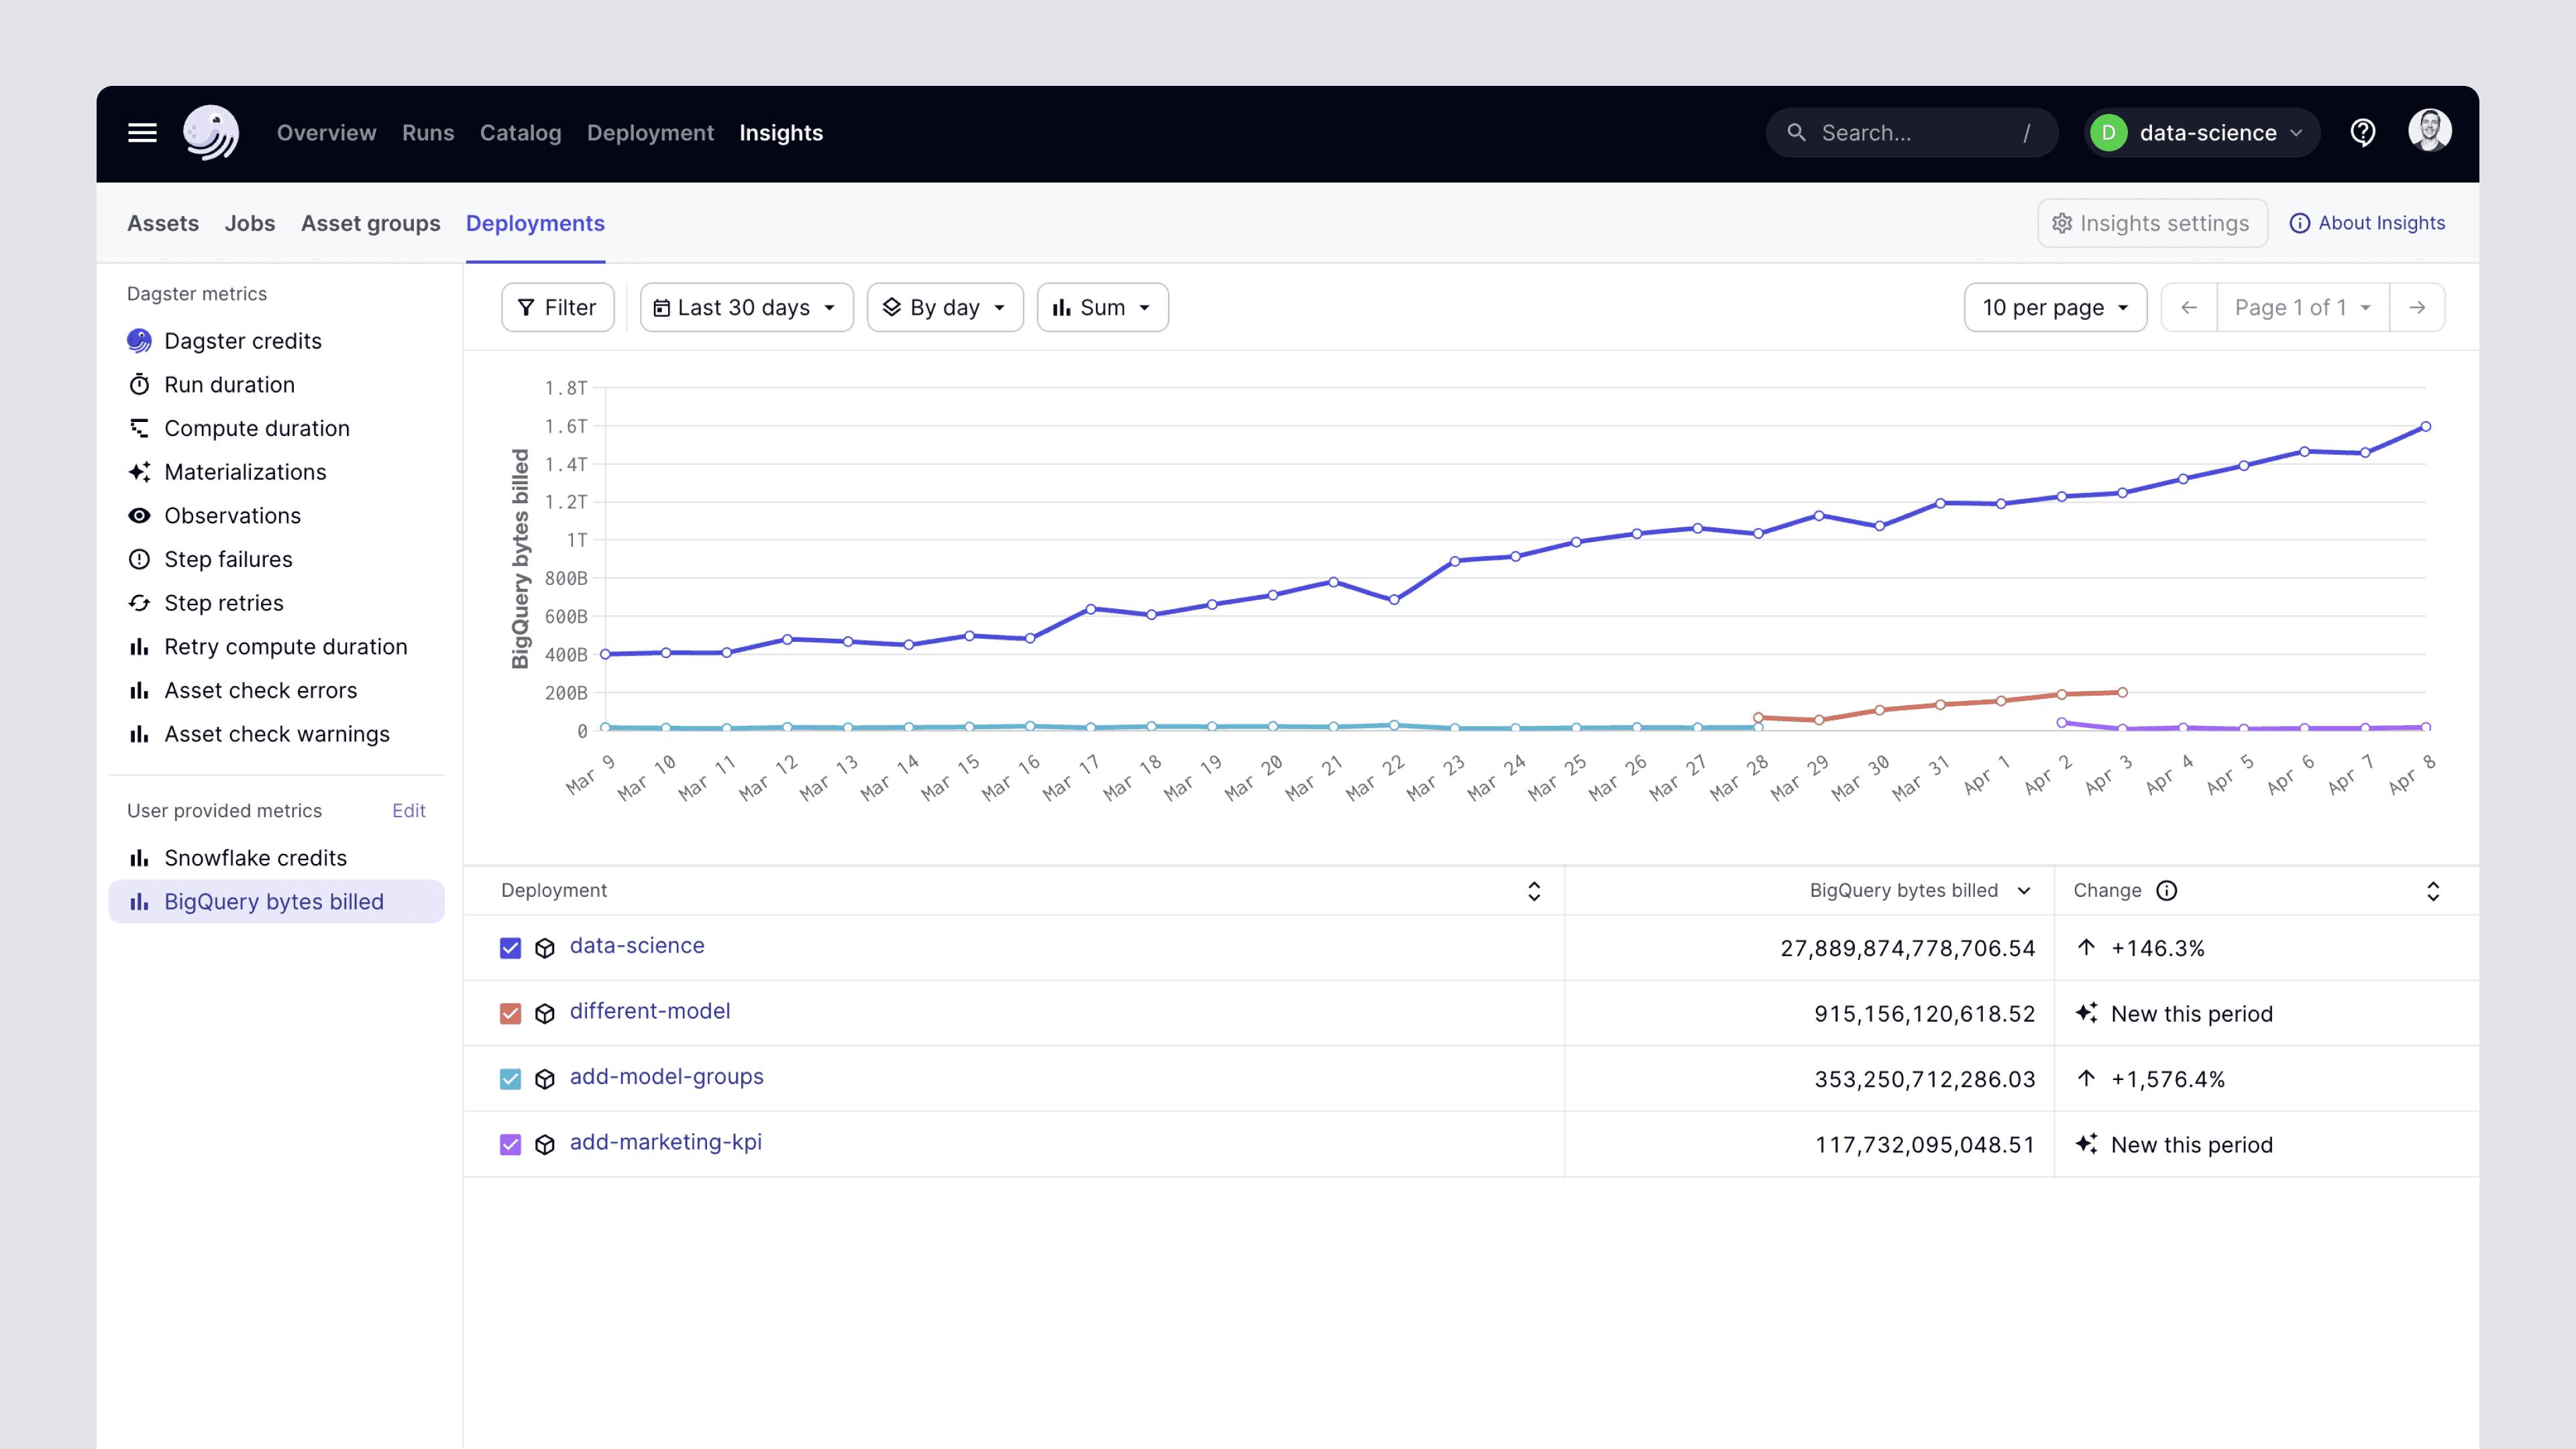
Let’s say you’re using BigQuery as your data warehouse. You’ve noticed that your bill has been increasing lately, but you aren’t sure which data assets might be responsible. With Dagster+’s new BigQuery integration, you can now visualize bytes billable in both data and dollar terms, enabling a direct connection between compute intensity and cost.
When you need to zoom all the way out, Insights also allows you to view your spend at a per-deployment level.
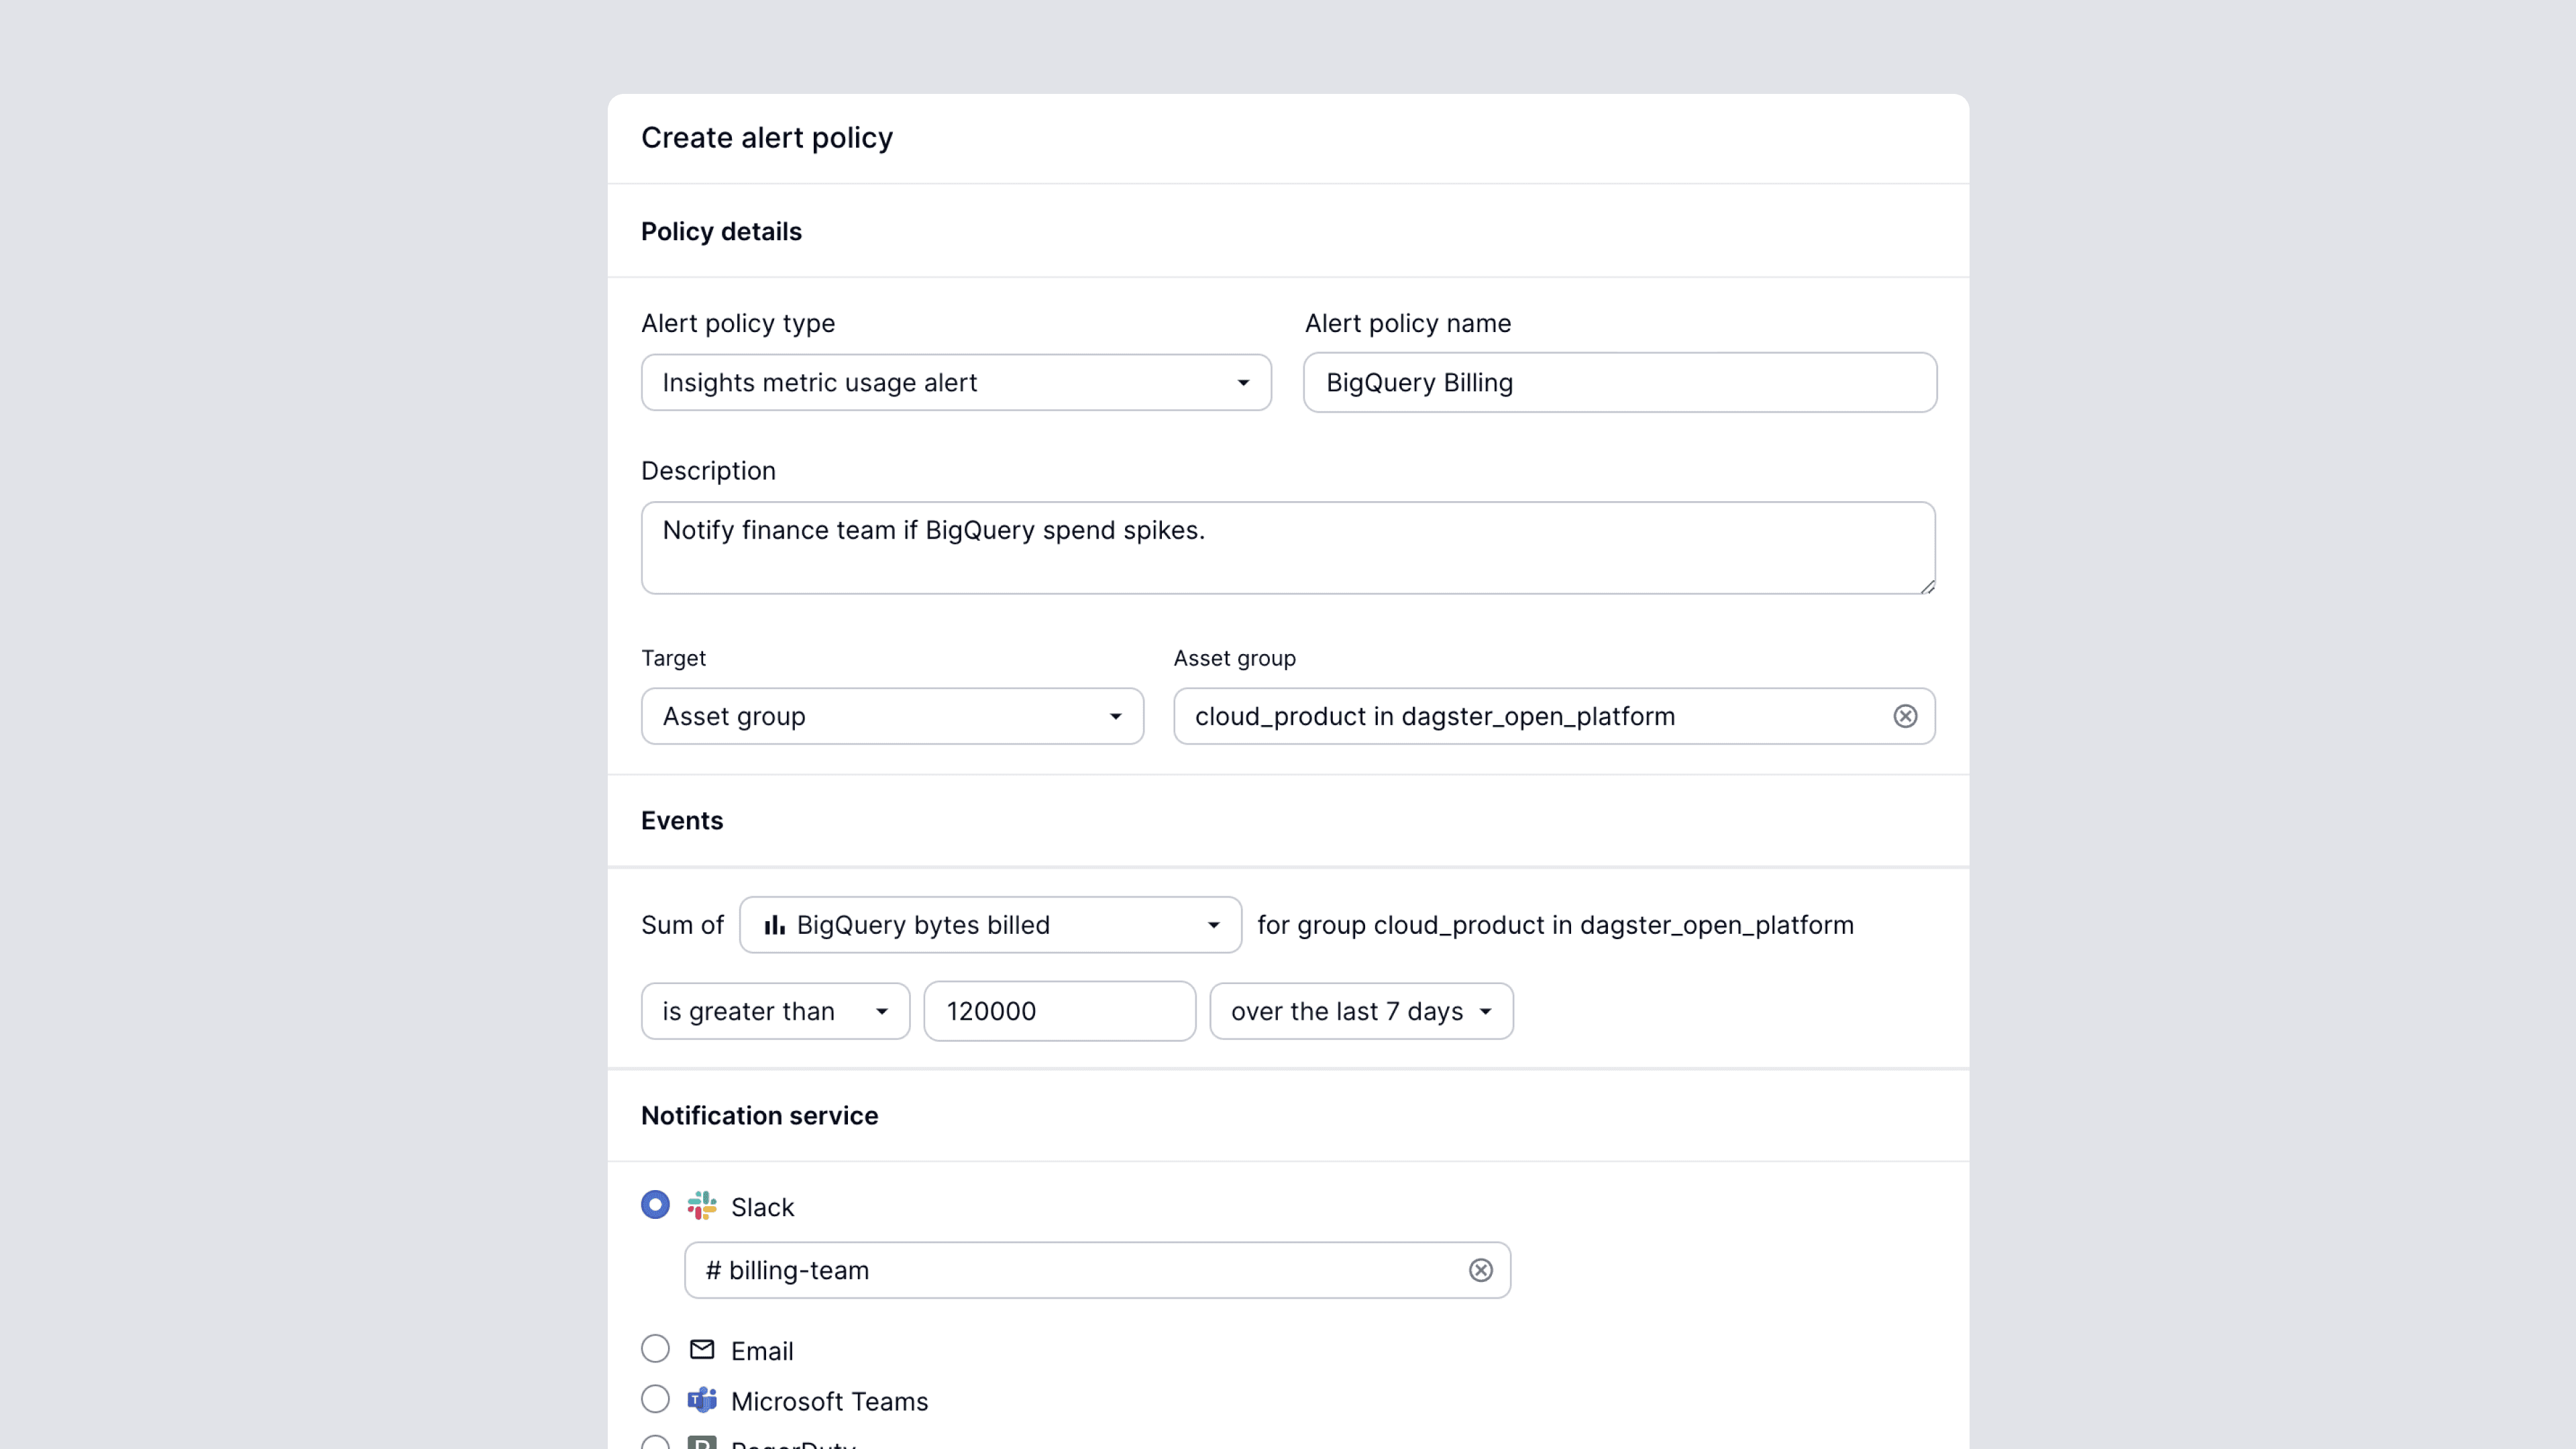
And with Dagster Alerts, you can set budget alerts when your BigQuery usage goes beyond a threshold.
Use Case 3: Enhancing Data Quality Monitoring
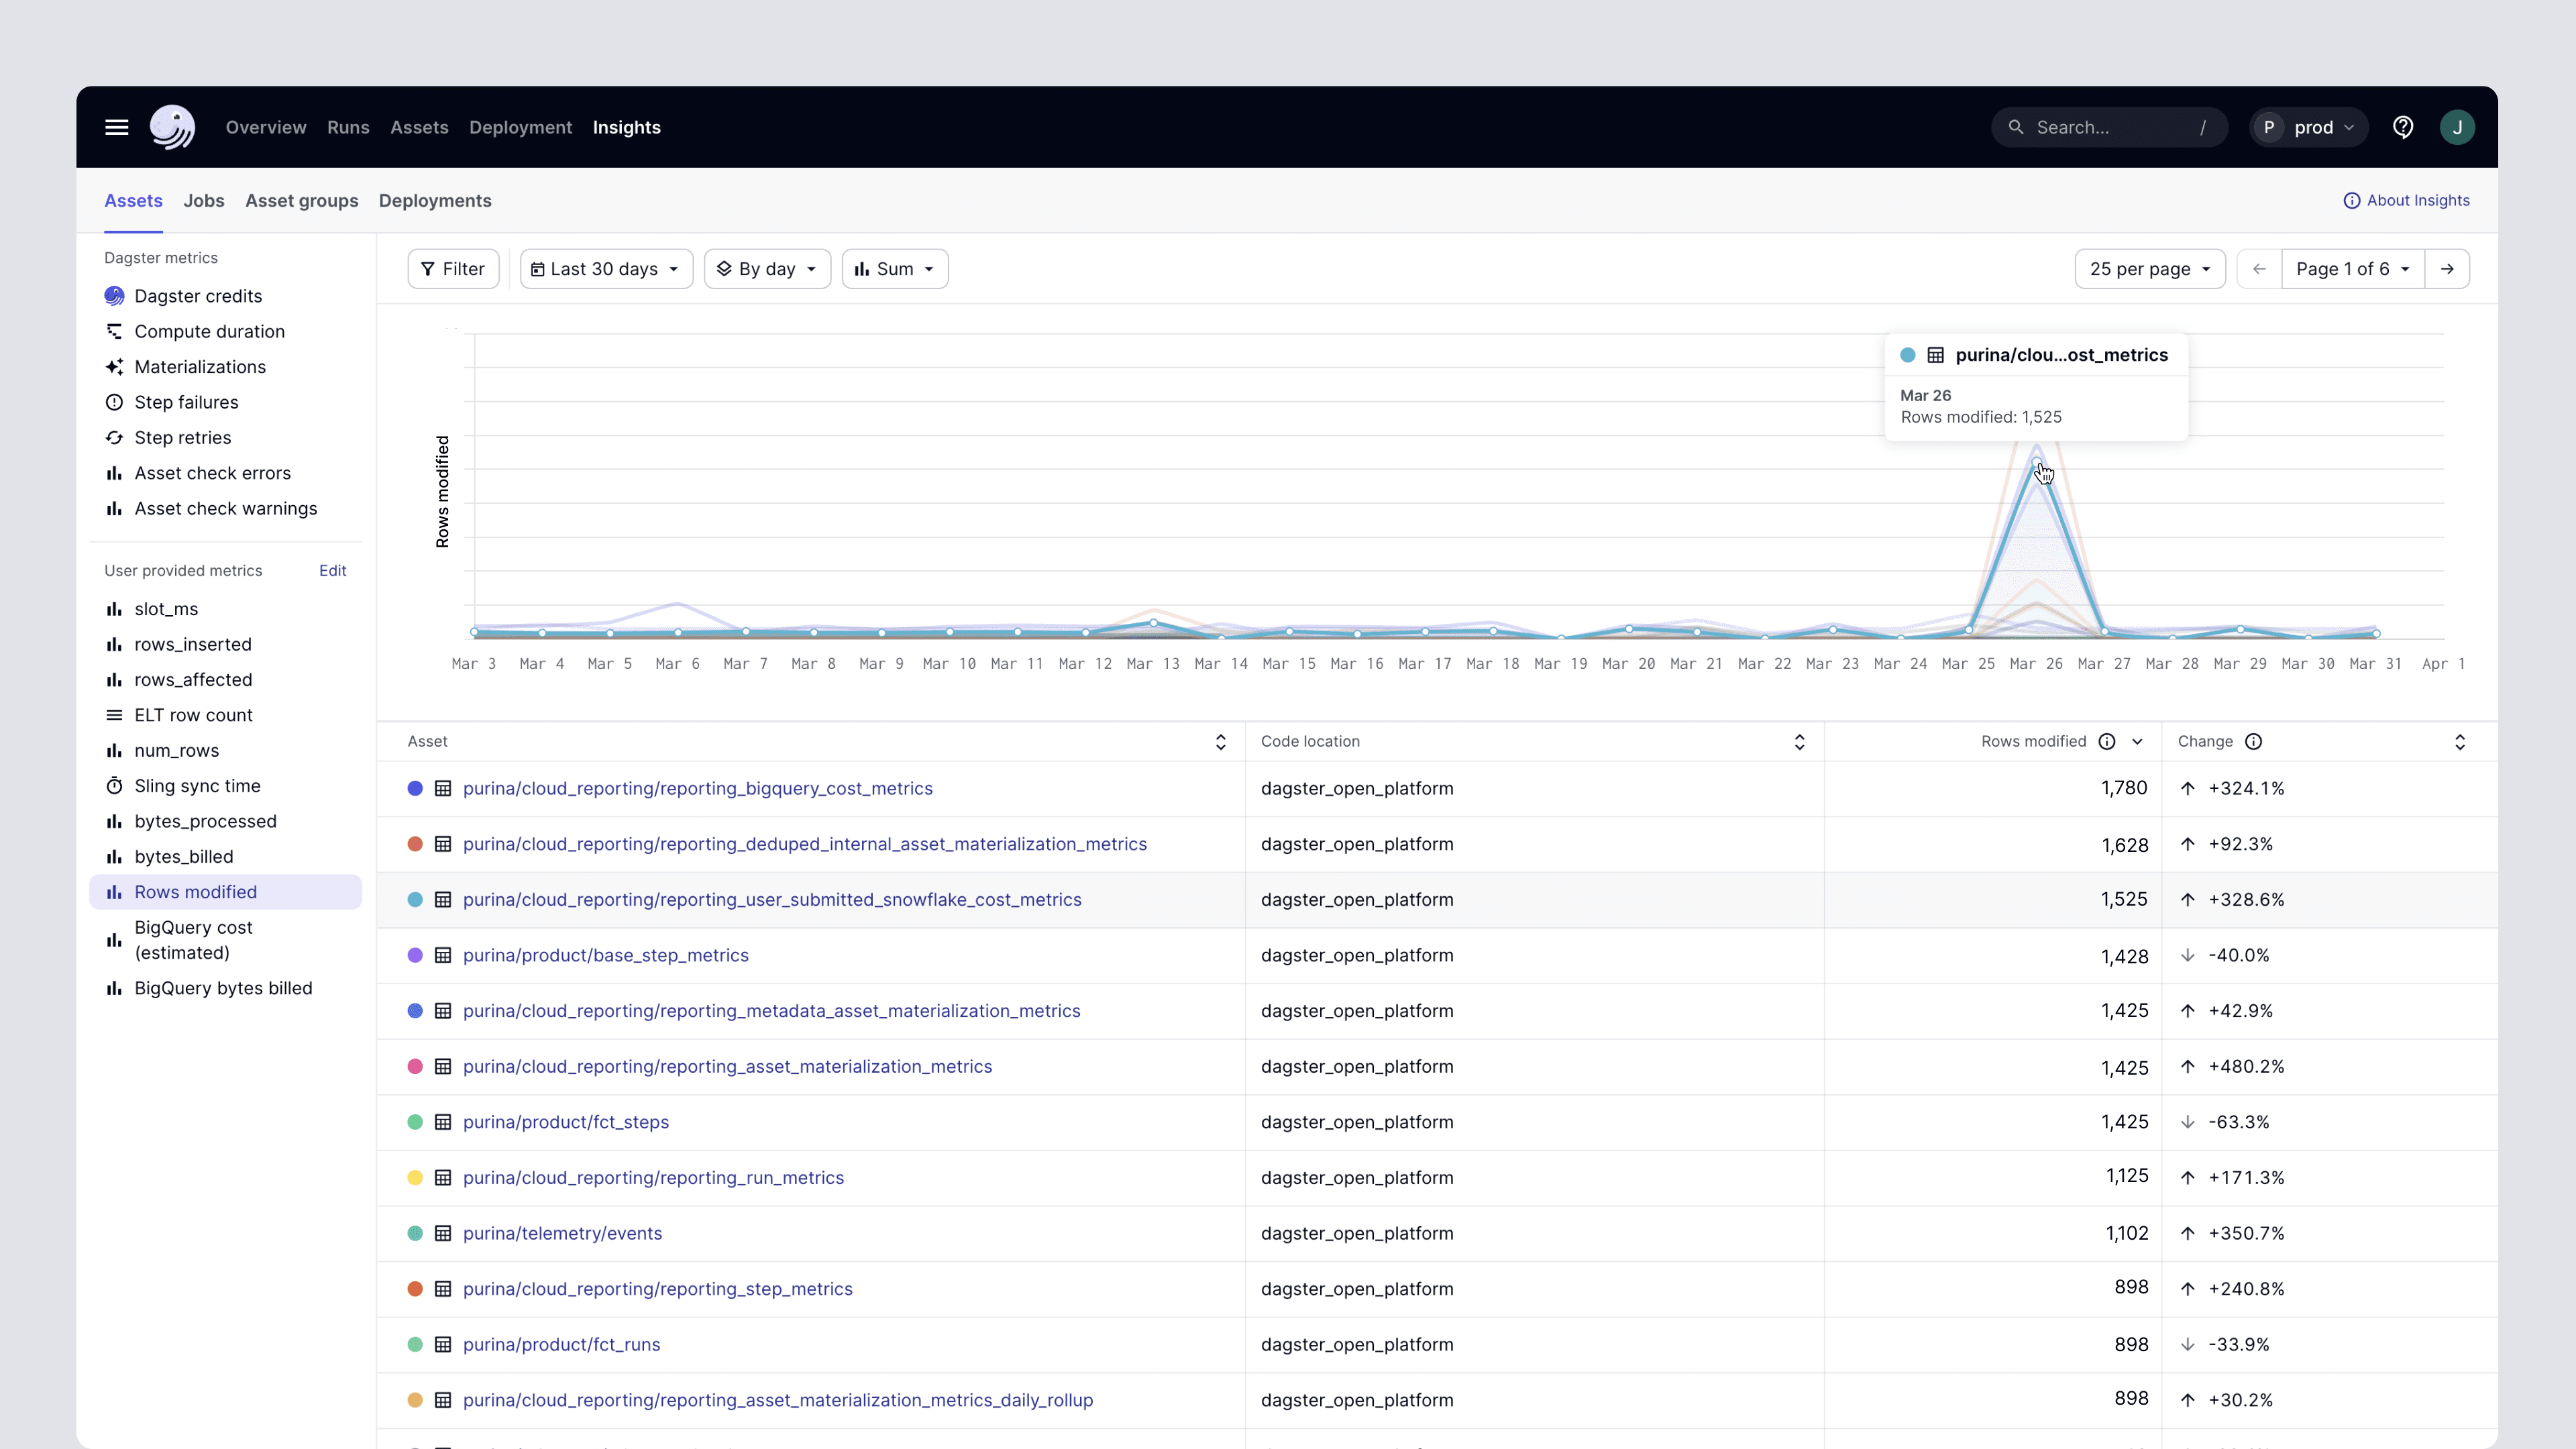
Finally, let’s talk about tracking the health of your dbt transformations. You’re using dbt to maintain a set of tables in your data warehouse. You’ve set up tests to track the health of those dbt models, including a Dagster asset check which counts the number of null values on the primary key.
In Insights, you can track this asset check as either the number of times the asset check failed or as the number of failures for this asset check over time. This is helpful, particularly in cases where an asset check might fail but the magnitude matters – an on-call engineer might not be worried if a single row fails a primary key check, but if 1,000 do they might need to escalate.

Bring Your Own Metrics
These examples are just the start of what you can do with Dagster+ Insights. Thanks to our flexible metadata system, any numeric metadata from assets or asset checks can be visualized in Insights. As one small example, we recently shipped an integration with OpenAI, and the metadata about OpenAI API calls and token consumption is available in Insights out of the box.
The Virtuous Cycle of Insights and Alerts
You can use Insights to track trends for freshness, quality, and cost of your data platform. Once you have a sense of expected behavior, you can tap into Dagster Alerts so that your team is notified when your cost goes above a certain threshold, or when you have more asset check failures than you expect. When you get an alert, you can jump right back into Insights to check whether the alert is part of a larger trend or an isolated issue.
The Future of Dagster+ Insights
Our goal with Dagster+ Insights extends beyond mere visualization. We're aiming to foster proactive management across data platforms, equipping teams with the tools to stay ahead of potential issues and optimize for both performance and cost.
We will be adding features to allow you to filter your metrics by tags and owner so that you can model data structure to reflect the schema of your organization.
Rolling Out the Red Carpet
Dagster metrics will remain accessible to all Dagster+ customers. User-provided metrics are an exclusive feature for our Enterprise tier. This stratification ensures that teams of all sizes can leverage the core benefits of Dagster+ Insights, tailoring their observability experience to match their platform's complexity and scale.


.jpg)
.png)


.png)

