


Gain operational observability on your data pipelines and bring cloud costs back under control with the Dagster Insights feature.
The modern data stack has democratized big data bills
Ah, the dreaded “let’s talk about your increased usage” email. Time to round up your technical stakeholders and finance team to figure out what budget is appropriate for the coming year.
The euphoria of powerful on-demand compute in data warehouses has given way to the hangover of pay-as-you-go pricing. Whether it's an ML engineer running a $30,000 backfill or a data analyst setting an operational dashboard to materialize 96 times a day, it's never been easier to set up data operations today that will cost you a ton of money later.
And this problem has only been compounded by the assortment of convenient point solutions that have become the foundation of the modern data stack.
Our tech stacks have become a black box where data operations go in and cloud bills come out.
Getting operational visibility is possible
If this sounds familiar, you’re not alone. We spent the last couple of months talking with our users to explore cost management best practices. We learned that nearly 70% of our customers felt that their cost management strategies were ineffective.
But some customers have dedicated the time and resources to improving their operational visibility, and here are the steps that were common their solutions:
- Build a data attribution system: Passing and retrieving metadata to attribute compute activity in the data warehouse to specific data activities at the business level. I.e..
- Compile the data set for analysis: collect and normalize this data for analysis. A common strategy would be to pipe it into the data warehouse.
- Create a feedback loop: this information has to be shared back to stakeholders on some regular cadence to find opportunities for optimization
Teams that take these steps can build at least some visibility into the cost of their operations. But they take a lot of effort and expertise to design, build and maintain, often at the expense of other important tasks.
Why metadata attribution is hard to do
Identifying the metadata you need, figuring out where it should go, and coming up with a plan to ensure that the metadata gets there is challenging. There will be different teams, different infrastructure combinations, recurring and adhoc data processes to consider, potentially multiple data warehouses, navigating this can be a real maze.
The technical strategy we typically see is for teams to try to pass their operational data from their data processes into the data warehouse. The data engineer defines the specific metadata that is passed to the compute layer by data pipelines at run time, and that operational data is later normalized and exported back from the compute layer to be analyzed on some fixed cadence.
This approach has some major drawbacks:
- Operational data is split between the orchestrator and the data warehouse, losing valuable context about the pipeline’s execution.
- It sometimes requires the creation of a technical governance layer
- It does not work well for teams with multiple data warehouses
We think teams should instead retrieve operational metadata from the data warehouse and attribute it to data processes inside the orchestrator.
We think you should aggregate operational metadata in the orchestrator
We believe that teams should use their data orchestrator as the starting point to solve these problems for the following reasons:
- The orchestrator sits at the intersection of all of your recurring data processes: Dagster sees the data flowing through multiple tools— from ingestion to processing, transformation, and visualization. By making it the gathering point for your operational metadata, you can avoid creating new data silos.
- It provides the essential building blocks for attribution: Dagster’s framework already gives you the tools you need to create, write and retrieve metadata both at run time and asynchronously
- It preserves operational context: Dagster already has first-class knowledge of the objects creating the metadata - it will know that snowflake cost is associated with a particular asset, it knows the definition of the asset, when it was materialized, who owns it etc. Keeping all of this data in one place speeds up the feedback/optimization process.
- It speeds up the feedback loop: by aggregating and attributing your operational metadata at the orchestration layer, teams can respond more quickly to trend changes in these kpis.
Introducing: Dagster Insights
Until recently, capturing metadata from your downstream systems and storing it in Dagster was challenging. Dagster didn’t make it easy to capture data that wasn’t available at runtime, and there were limited options for exploring Dagster information in aggregate.
Today we’re announcing the launch of Dagster Insights, a collection of a metrics store and API, tooling for capturing operational metadata, and a new set of visualizations within the UI all of which help shine a light on the performance of your data platform.
Dagster Insights will make it easier to capture operational data from pipelines and downstream systems and explore that data within the UI, or export it to other tools. These features are being released on request to Cloud customers who are interested in trying the features and giving us feedback.
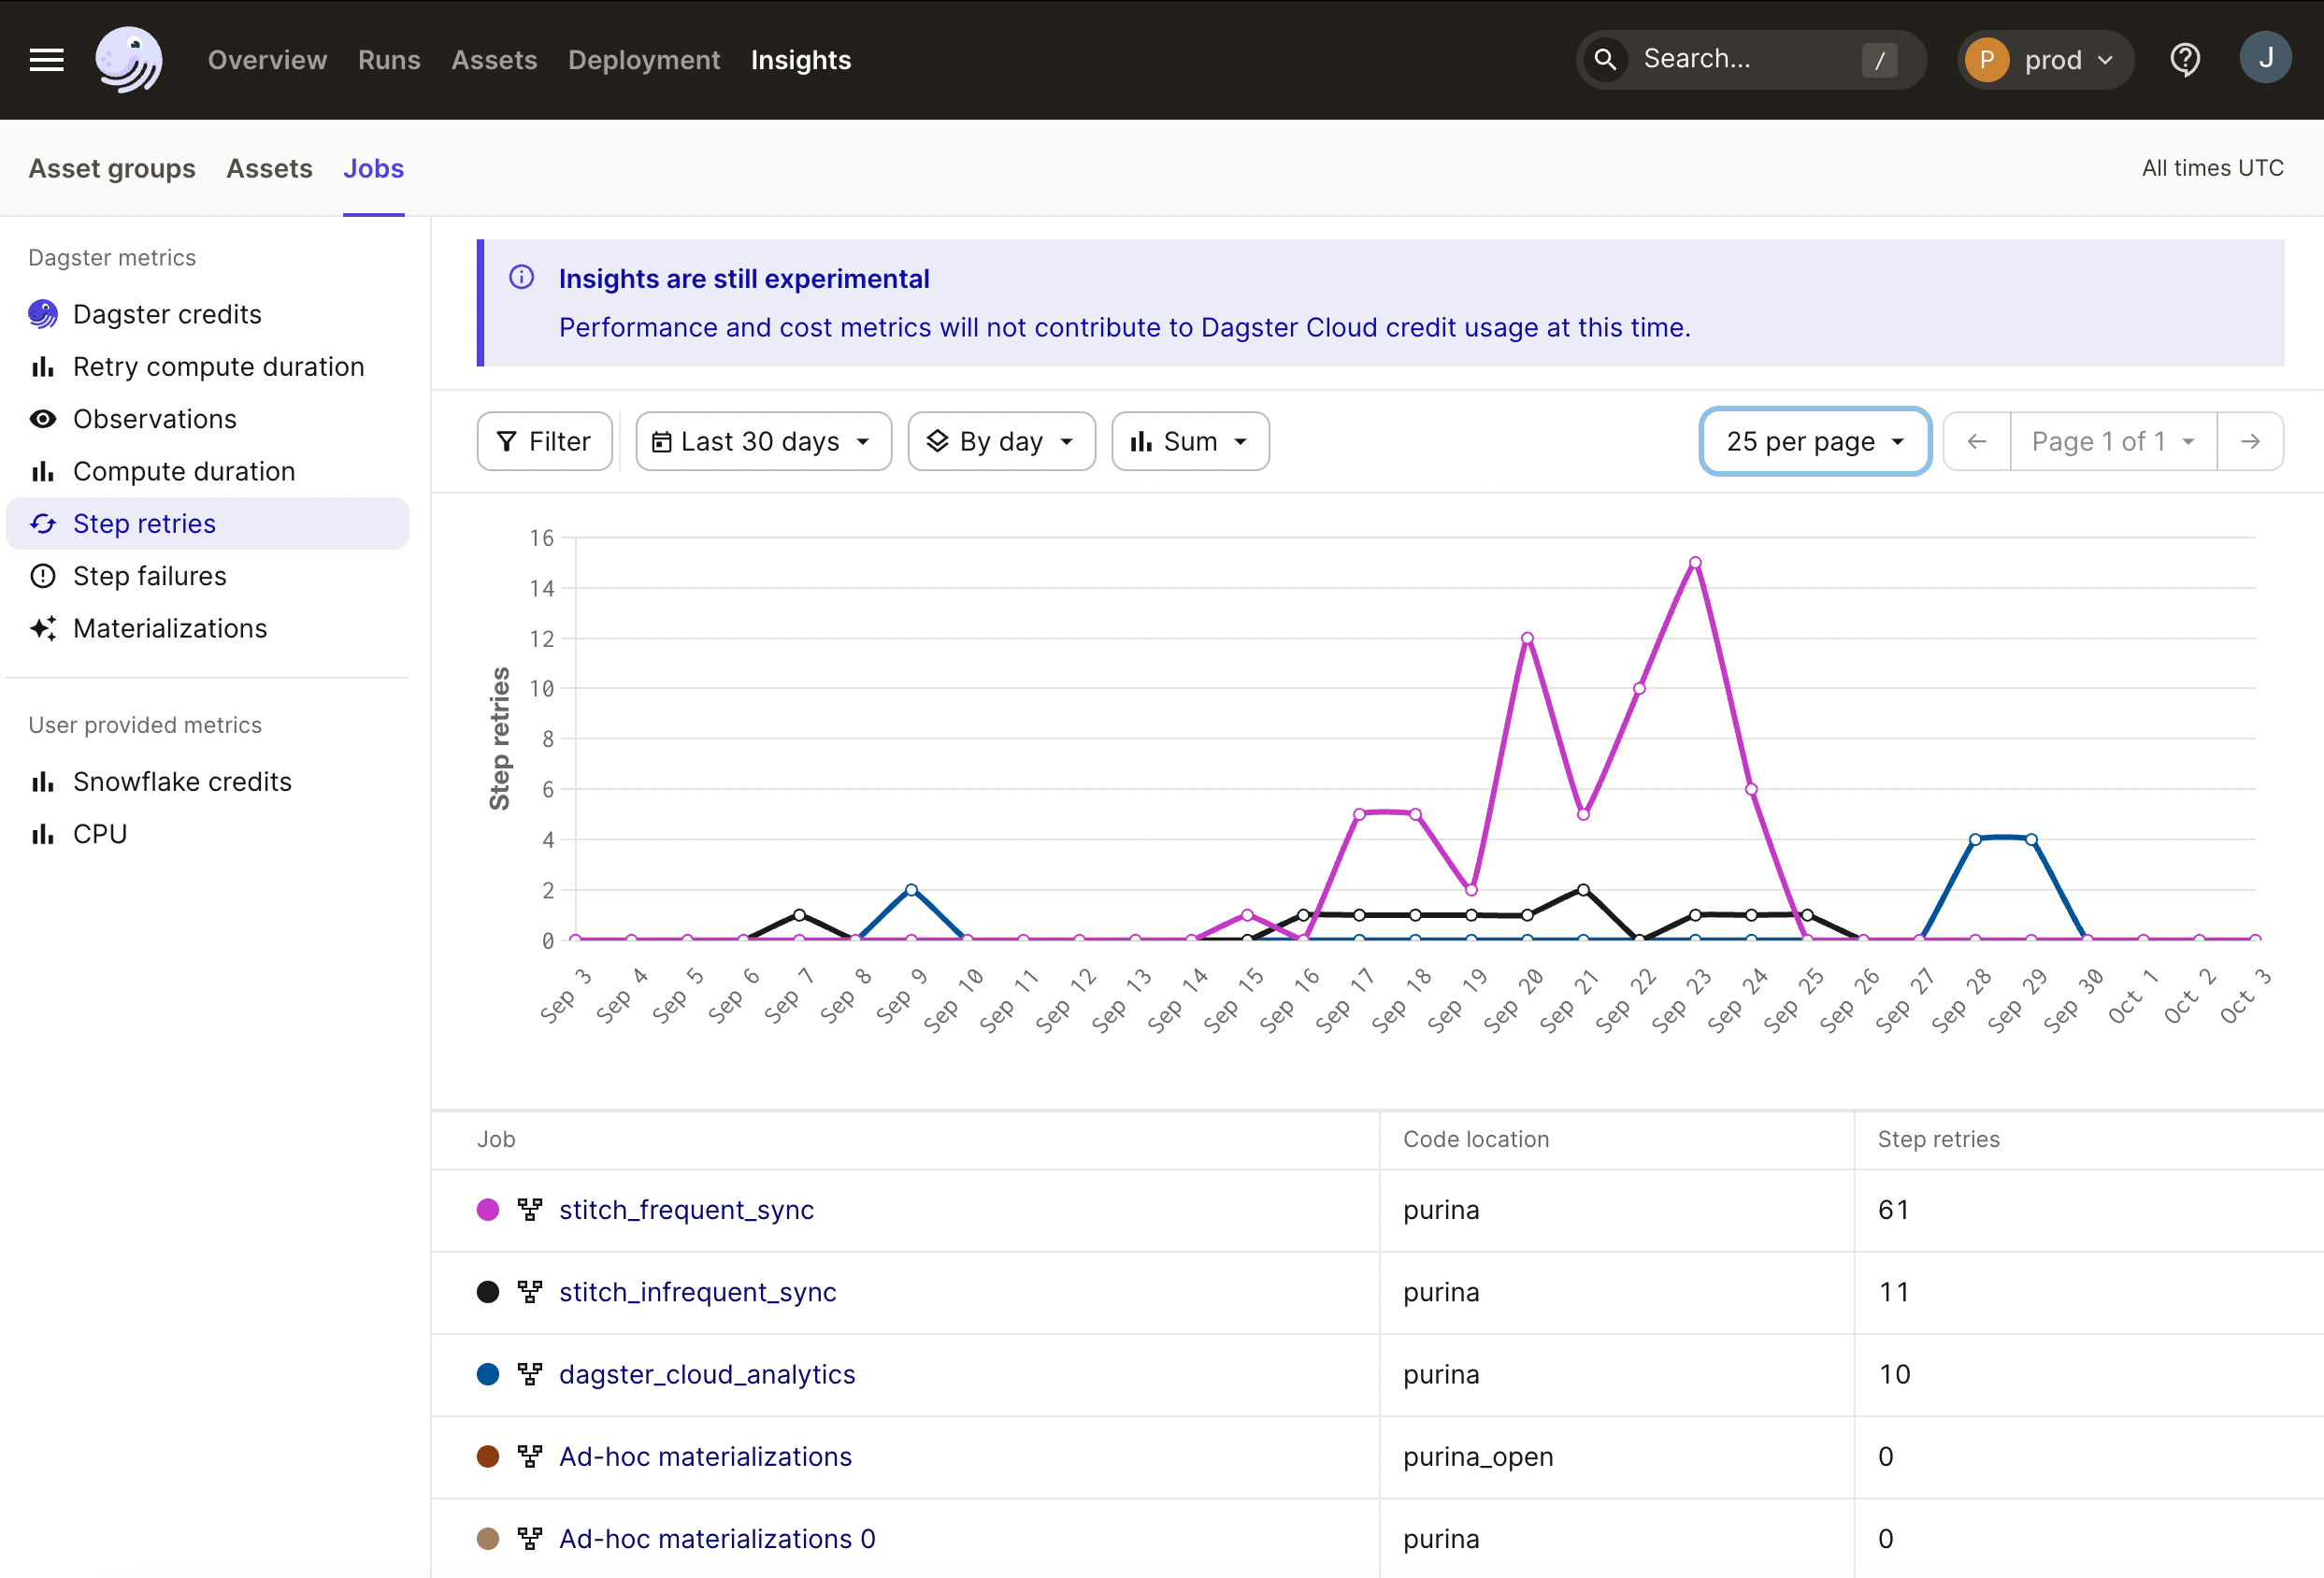
Platform-level visualization for operational metrics
Sometimes, you’re not sure where you need to focus your attention between your data pipelines. Maybe it's not obvious which assets or jobs are the most compute intensive, or which things are being run the most regularly.
Dagster can now provide aggregated data to give data teams a birds-eye view about the performance of pipelines, starting with the basic KPIs generated by Dagster such as compute duration, failures, retries, and materializations and more, helping to answer such questions as:
- where are my resources being used?
- what are my most compute-intensive assets and data operations?
- what pipelines are wasting the most compute time on retries?
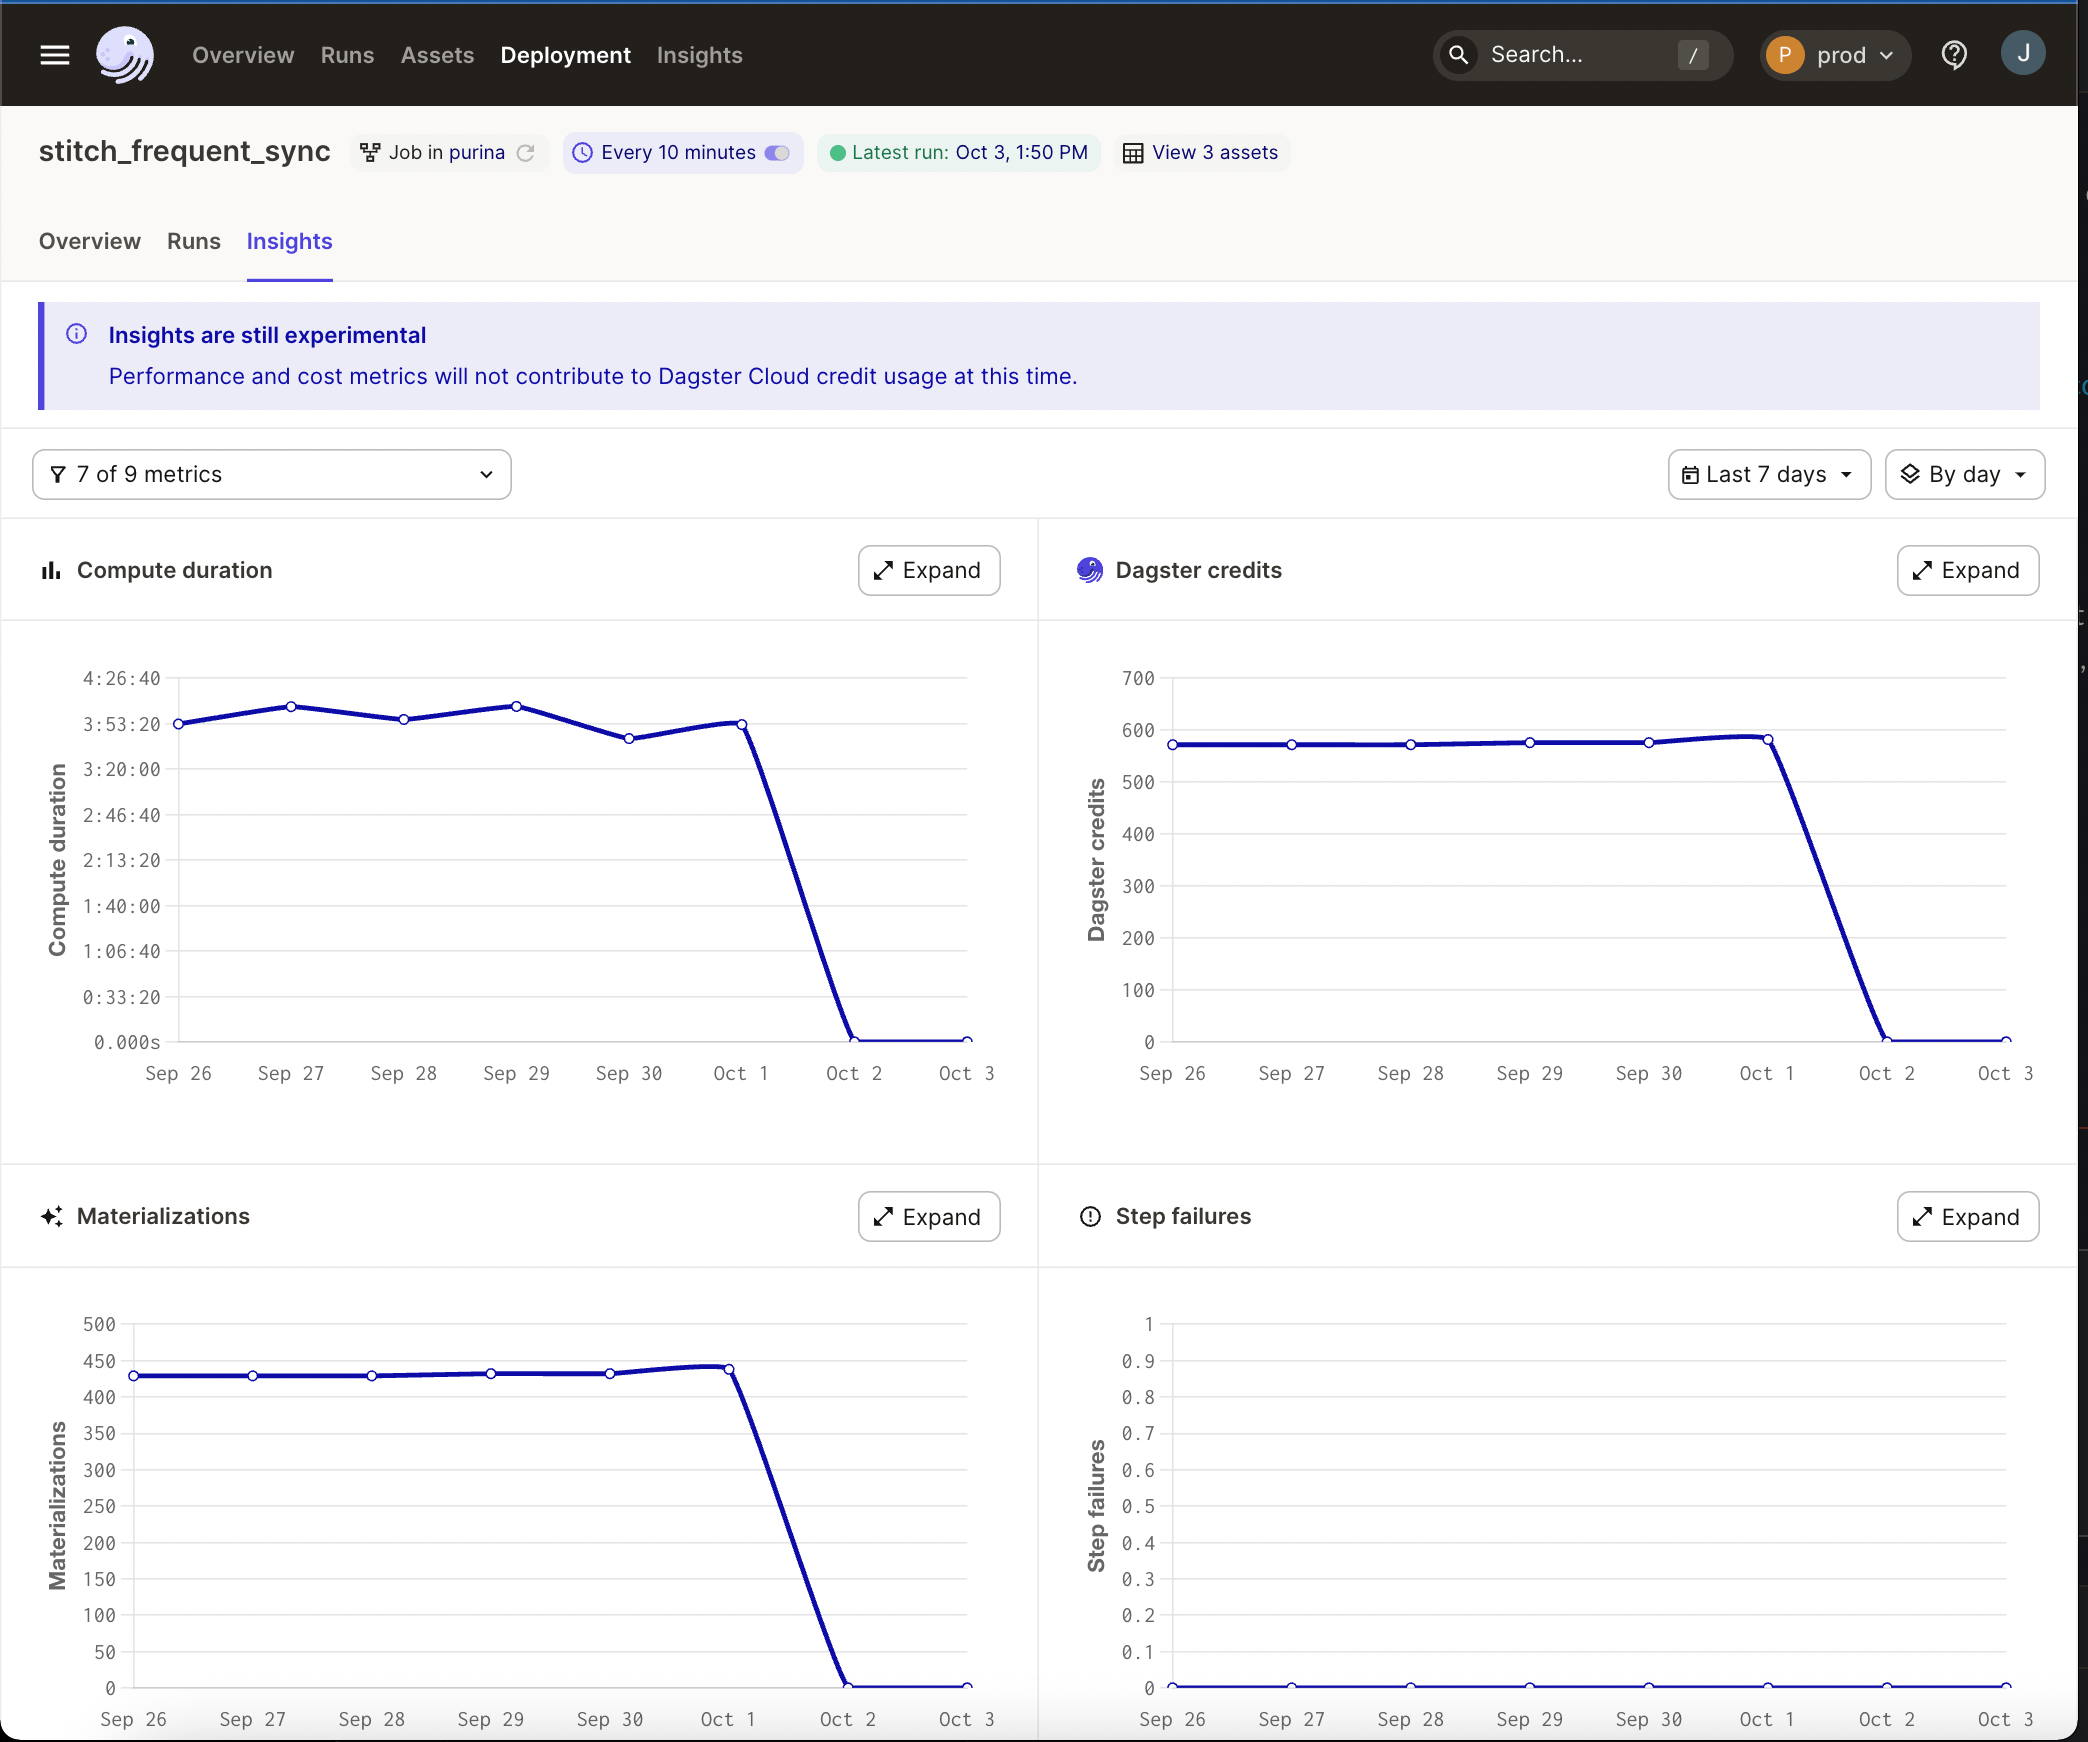
Definition-level visualization for troubleshooting
A birds' eye view is useful for finding areas for investigation, but sometimes you need to dive into the pipeline or the asset for troubleshooting. Dagster Insights will make it possible to drill down into key metrics for specific data objects and answer questions like:
- why is my compute duration increasing so quickly?
- when did the increase in step failures begin?
Mechanisms for capturing and storing additional metadata
While visualization of basic metrics can be helpful, we know that Dagster’s metadata by itself isn’t enough to get at the operational insight that teams want. So we’ve also added some capabilities for capturing and storing metadata that make it easier to:
A Metrics Store + API
Historically, Dagster’s metadata capabilities were limited to the data that could be captured and written into the event history log at run time. With the addition of a new API and data processing back end, important operational information about the characteristics of a data process can be written anytime.
from dagster_cloud.dagster_insights import dbt_with_snowflake_insights
@dbt_assets(...)
def my_asset(context: AssetExecutionContext):
   dbt_cli_invocation = dbt_resource.cli(["build"], context=context)
   yield from dbt_with_snowflake_insights(context, dbt_cli_invocation)
Tooling to capture real-time operational data
We’ve added methods and capabilities to the dagster-cloud package that make retrieving this information from pipelines at runtime as simple as adding a few new lines of code. Out of the box, we’re providing tooling for easily capturing a defined set of metadata coming from dbt+snowflake, but we’ll soon open this up for capturing both predefined and arbitrary metadata from any downstream system.from dagster_cloud.dagster_insights import (
create_snowflake_insights_asset_and_schedule,
)
snowflake_insights_definitions = create_snowflake_insights_asset_and_schedule(
start_date="2023-10-5",
snowflake_resource_key="snowflake_insights",
)Retrieve and submit latent operational data
Capturing all of the metadata you need for operational visibility is a challenge because some kinds of data just aren’t available until after the computation is over. For example… credits in Snowflake. So, we’ve built an easily configurable data pipeline for retrieving data from those data sources and writing it back to Dagster’s metrics store. For now, this tooling is specific to Snowflake, which generates latent cost data, but it will be easily adjusted to other tools.The release plan
Available to Cloud customers only
While visualizing and exploring Dagster-generated metrics within the UI will be available to all cloud users, capturing external metadata in our metrics store will be an Enterprise-only feature.
Coming Improvements
As part of the experimental release, out-of-the-box utilities for capturing external metadata are limited to dbt+Snowflake pipelines creating software-defined assets.
We plan to quickly follow up with additional data sources and capabilities for capturing arbitrary metadata, as well as native tooling for enabling these capabilities on pipelines using the ops / jobs framework in the coming weeks.
Enabled on request
Dagster Insights is an experimental feature, which means that it can only be enabled on request from our team. To get access to it, please reach out to us directly through your company slack channel or by joining #dagster-insights to request it, and read more about the status of the experimental release here.


.jpg)
.png)


.png)

