


Recent enhancements allow Dagster to surface clearer and more actionable errors to accelerate your development cycles.
In this article, we will delve into recent improvements in surfacing errors we have built to enhance the Dagster developer experience in the 1.3 release, in both Dagster Open Source and Dagster Cloud.
Any developer can attest that a large part of our job involves dealing with errors, and that errors come in many different degrees of usefulness. When something breaks, we might strike gold and find ourselves with a detailed stack trace that pinpoints exactly where the problem is and how to fix it. But just as frequently, we're faced with inscrutable error codes, sporadic crashes that are impossible to reproduce, or the dreaded “Something went wrong”.
Grappling with errors is hard enough when the surface area of our work is isolated to just a single machine. As data engineers, however, we inevitably deal with many disparate systems and environments, each with its own idiosyncratic flavor of edge cases and errors. For example, when faced with an error like this when spinning up a new job in an Amazon ECS cluster:
DNS resolution failed for myjob-de906371f79d85188234c23ec44a8f1534cf4f34-38c2b8.serverless-agents-namespace-1:4000: C-ares status is not ARES_SUCCESS qtype=A name=myjob-de906371f79d85188234c23ec44a8f1534cf4f34-38c2b8.serverless-agents-namespace-1 is_balancer=0: Domain name not found
A seasoned platform engineer might know what ARES_SUCCESS means and what makes it desirable, but depending on team members accumulating those battle scars creates significant barriers for newcomers to a team. To be fair, I personally had no idea what it meant, and neither did most of the otherwise-very-talented engineers on the Dagster Labs team.
How Dagster surfaces errors
Dagster is an orchestrator for the whole data engineering development lifecycle - and an essential part of that lifecycle is debugging and dealing with errors. Previously, we discussed some of the debugging features of Dagster. We think of the interface for displaying errors in Dagster user code as one of our core user-facing surfaces, and as a result, we continue to invest a lot of effort to ensure that errors are displayed in Dagster with as much context as possible.
Sending Structured Errors across Process Boundaries
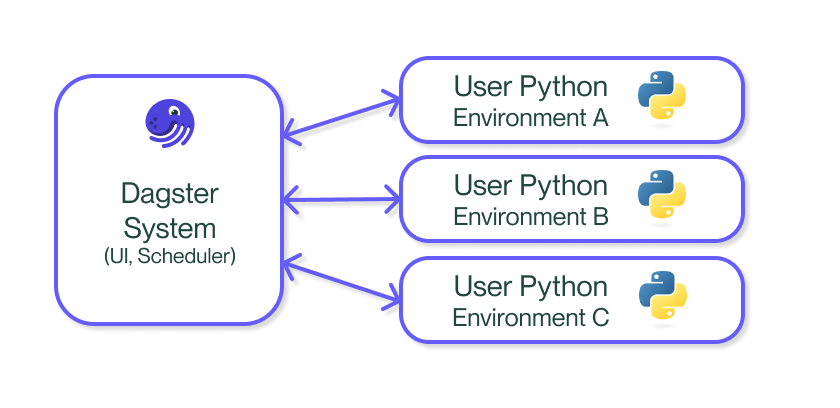
One of the core design principles of Dagster's architecture is that user code never runs in the same process as Dagster system code, with all communication between the two happening over a structured API. This unique design lets users run code in multiple isolated Python environments simultaneously, preventing issues in one user-defined job from destabilizing the system.
Errors are considered part of the structured API between user code and system code - when an error is raised within Dagster code, the full recursive stack trace is captured in a custom serialized format.
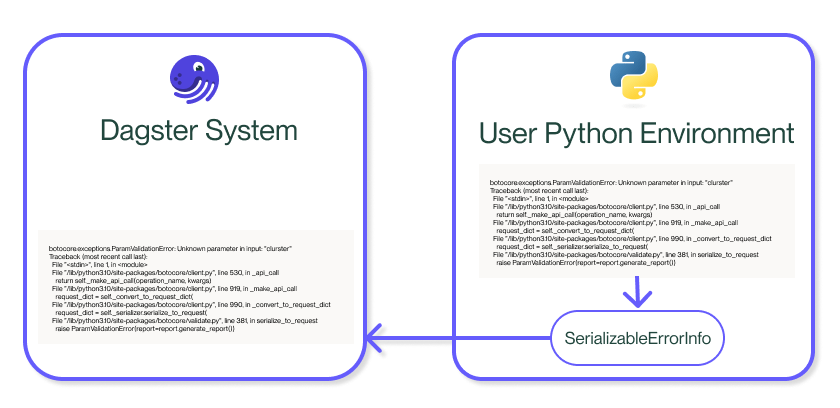
These stack traces can be safely displayed in system processes like the UI while still maintaining separation between system code and user code, and let Dagster users take advantage of the scalability of the cloud without having to sacrifice observability when something inevitably goes wrong within user code.
Interested in trying Dagster+ for Free?
Enterprise orchestration that puts developer experience first. Serverless or hybrid deployments, native branching, and out-of-the-box CI/CD.
Surfacing platform errors, not just code errors
Many errors are simply problems in code, where the root cause of the problem can be captured in a stack trace, and the remediation can be easily derived. The serialized errors described above generally handle these cases well. However, there are a multitude of potential problems in production systems that cannot be cleanly expressed as just a Python exception.
Take a Kubernetes pod running a Dagster job, for example. It might fail to start up due to any of the following reasons:
- The pod is configured to use a secret that doesn't exist
- The pod has requested more resources than the cluster has available.
- The Docker image was built using the wrong system architecture.
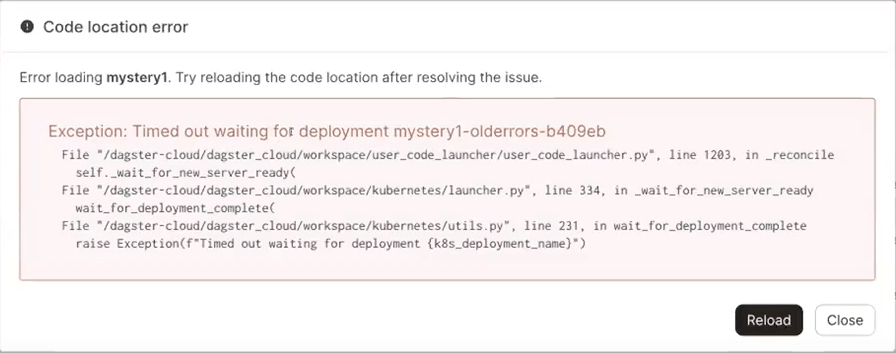
If our error reporting relied solely on Python exceptions raised from within user code, these would have nothing to show - the pod that runs the code never spun up in the first place, and even if it did, it wouldn't have the context to understand what went wrong or how to fix it. This resulted in frustrating experiences for our users - instead of clear and actionable errors they saw cryptic timeouts like this:
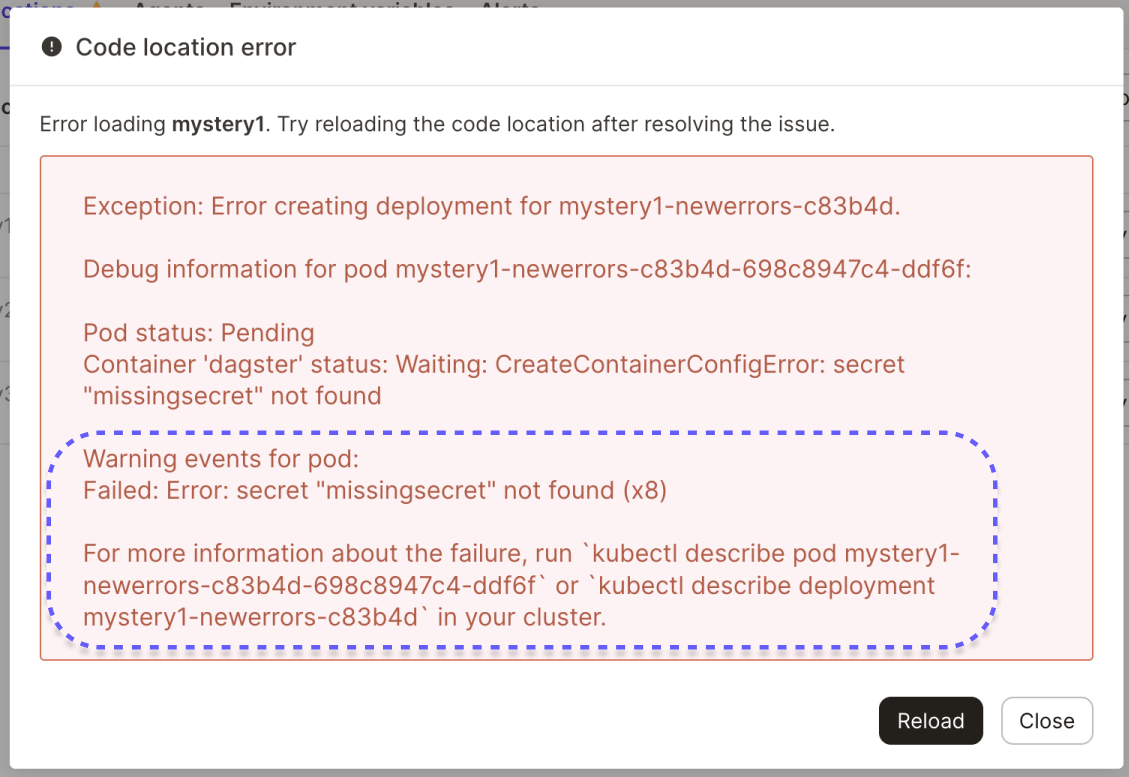
To fix this, we built a separate monitoring process that's responsible for periodically checking in on all of a Dagster deployment's in-progress runs. If it detects that the run has moved into a problematic state, it gathers context about the container in which the run is happening and surfaces a detailed error message including logs, context about the environment in which the job was running, and suggested next steps to investigate further.
For example, the previously shown task that timed out due to a missing secret now displays an error like this—containing the key insight that the pod failed due to a missing secret—and instructions about what to do to investigate further:
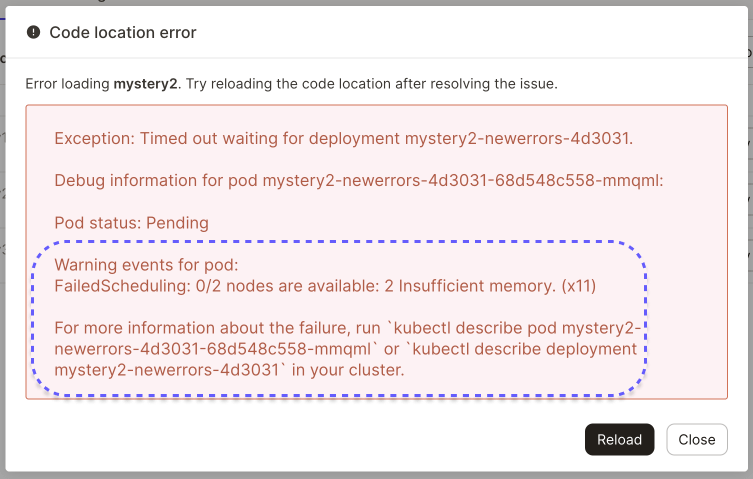
A task that failed due to running out of memory previously would have failed with a similarly inscrutable timeout, but now looks like this:
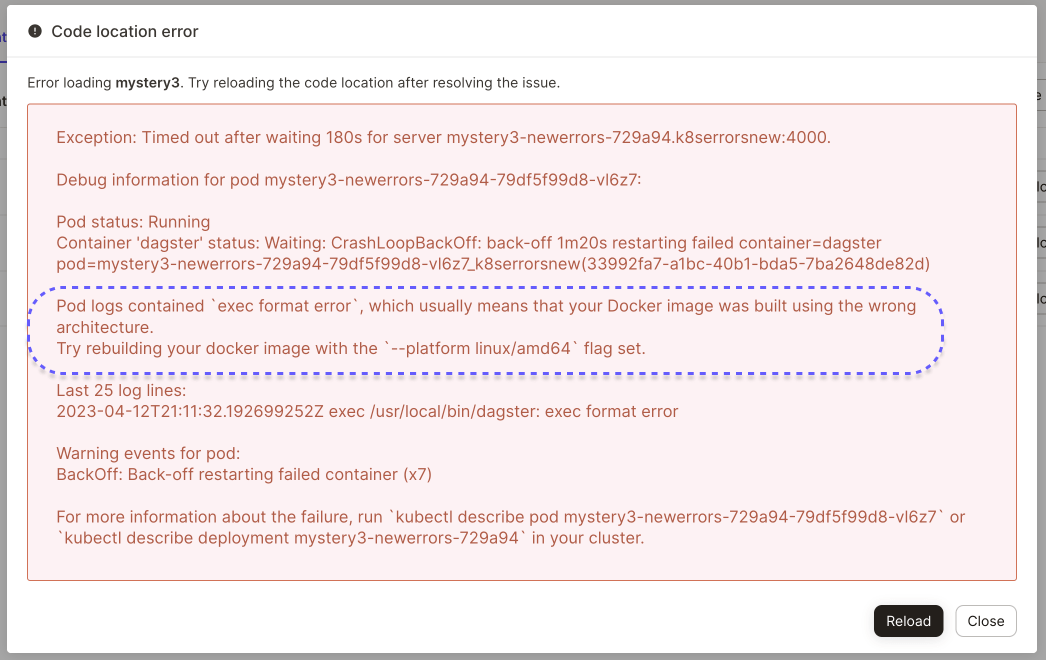
And particularly thorny issues like building your image using the wrong system architecture can now include specific guidance for how to resolve the issue:
We plan to continue enhancing these capabilities over time to cover more and more failure cases.
Conclusion
Data orchestration tools are playing a more vital role today than simply scheduling tasks and reporting back on the basic “success/failure” state. To deliver on the premise of the full development lifecycle, the orchestration layer has to provide more in terms of error reporting, helping data engineers rapidly and surgically pinpoint issues. Short of this, the tool is wasting your time.
While this is not an easy task in a complex distributed tech stack, we continue to make inroads in delivering a better developer experience.


.jpg)
.png)


.png)

