


What Are Data Observability Tools?
Data observability tools are software that help organizations monitor and ensure the health, reliability, and quality of their data and data pipelines. Popular tools include Dagster, Monte Carlo, Datafold, Bigeye, Sifflet, Soda, and Anomalo, which offer automated monitoring, anomaly detection, and root cause analysis to help prevent and resolve data issues.
Key features of data observability tools include:
- Automated monitoring: They use agents and integrations to automatically monitor data across its lifecycle, covering aspects like freshness, volume, and schema changes.
- Anomaly detection: Tools use machine learning to identify unexpected deviations from normal data patterns, helping to detect issues proactively.
- Root cause analysis: They provide tools to trace the origin of data problems, helping teams understand and resolve incidents faster.
- Data lineage: They map the flow of data from source to destination, providing context and helping to assess the impact of issues.
- Alerting and notifications: Configurable alerts notify teams of problems via tools like Slack or email, enabling timely responses.
This is part of a series of articles about data quality.
Key Use Cases of Modern Data Observability Tools
Automated Monitoring
Continuous data monitoring is the foundation of observability tools, automatically tracking metrics such as completeness, freshness, accuracy, and schema changes. Monitoring modules surface relevant key performance indicators (KPIs) on customizable dashboards, giving data engineers and analysts immediate visibility into system status and data quality health.
These dashboards update in real time, ensuring issues are quickly noticed and acted upon. Beyond passive monitoring, alerting systems deliver proactive notifications when thresholds or validation rules fail, sending alerts via email, Slack, pager services, or other communication platforms.
Anomaly Detection
Anomaly detection uses statistical, machine learning, or rule-based models to automatically identify irregularities in data streams and datasets. These could be sudden spikes, drops, missing data, or inconsistencies that deviate from historical patterns or expected thresholds. Continuous anomaly detection is key for organizations to spot quality issues or operational failures early, allowing data teams to intervene before these anomalies impact analytical outputs or business decisions.
Modern tools typically support both automated and customizable anomaly detection, letting users define their own conditions or enable algorithms that learn what "normal" looks like for specific datasets. Automated alerting is then triggered when an abnormal trend occurs, either through dashboards or direct notifications.
Root Cause Analysis
Automated root cause analysis quickly diagnoses why a detected data issue has occurred, pinpointing its origin within the complex web of modern data ecosystems. These features sift through pipeline logs, metadata, and event triggers to map out the sequence of events that contributed to the anomaly or failure. They often generate suggested remediation steps, which can significantly reduce the mean time to resolution (MTTR) for data incidents.
Another benefit of automated analysis is that it lessens the dependency on individual expertise within the team. Rather than relying on manual investigation or tribal knowledge, teams receive direct insights to guide them toward corrective actions. This level of automation helps foster a culture of accountability, transparency, and consistent quality in managing complex and evolving data infrastructure.
Data Lineage
Data lineage visualization provides a graphical representation of data’s path across the organization, from its origin through every transformation and downstream consumer. This capability is essential for understanding dependencies between datasets, tracing the source of errors or unexpected values, and complying with data governance requirements.
Lineage tools expose both high-level flow diagrams and detailed step-throughs of granular transformations, giving data teams clarity into how, where, and why data changes. Lineage diagrams aid impact analysis, helping teams evaluate the consequences of upstream changes on downstream processes before making modifications.
Alerting and Notifications
Alerting and notifications are critical for ensuring data issues are identified and acted upon in real time. Observability tools allow teams to configure alerts based on predefined thresholds, validation rules, or anomaly detection triggers. These alerts can be fine-tuned to specific datasets, pipeline stages, or business logic, ensuring only relevant and actionable incidents are surfaced.
Notifications are typically integrated with collaboration and incident management platforms like Slack, Microsoft Teams, PagerDuty, or Opsgenie. This integration ensures alerts are routed to the appropriate personnel or teams without delay, enabling faster triage and resolution. Some platforms also support escalation policies and alert grouping to avoid redundant messaging and to simplify incident workflows.
Notable Data Observability Tools
1. Dagster

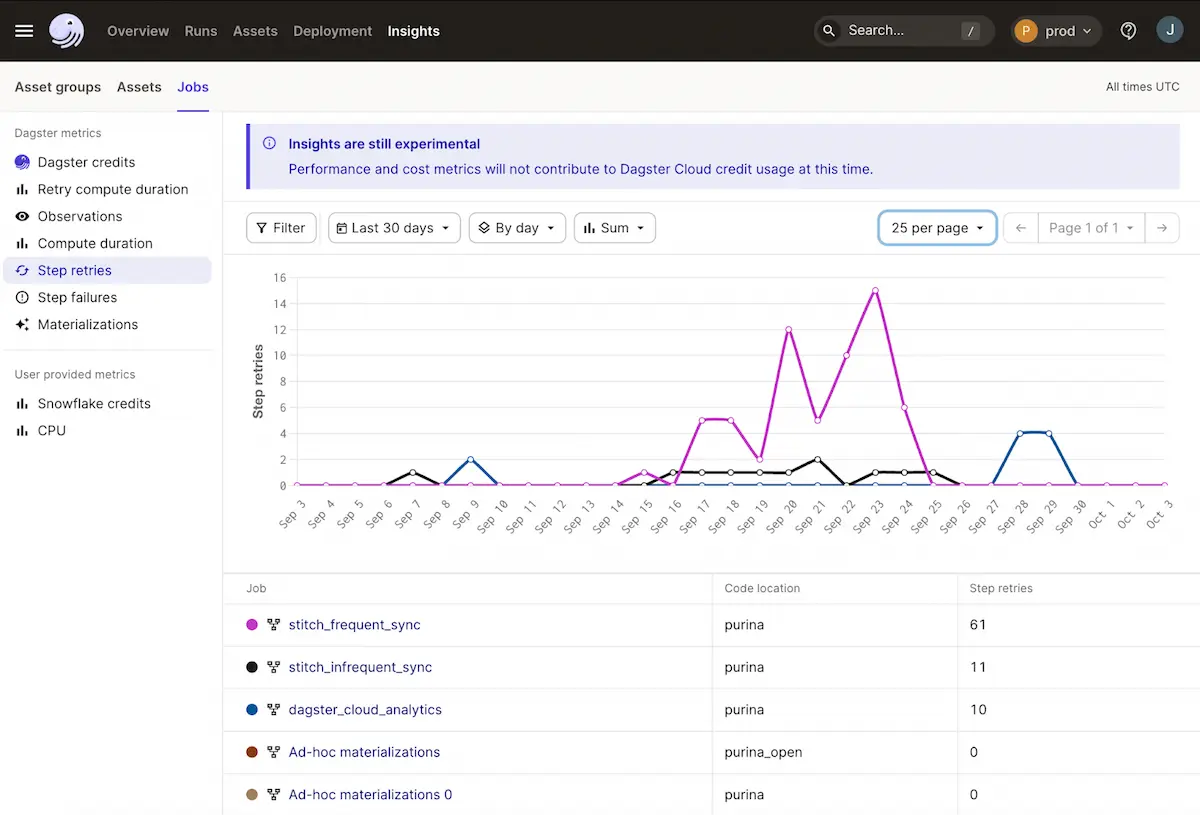
Dagster is a data orchestration and observability platform that helps teams build, operate, and monitor reliable data pipelines by embedding observability directly into data asset development and execution. Instead of treating observability as a separate monitoring layer, Dagster provides asset-centric visibility into data freshness, lineage, failures, and quality as pipelines run, enabling teams to identify issues earlier, understand downstream impact, and resolve incidents within the same system used to define and operate data workflows.
Key features include:
- Asset-based observability: Tracks the health, freshness, and execution status of data assets aligned to business concepts rather than just tables or jobs
- Native data lineage: Automatically maps upstream and downstream dependencies to support impact analysis and root cause investigation
- Integrated data quality checks: Runs declarative quality checks and validations as part of pipeline execution to prevent bad data from propagating
- Event-driven alerting: Sends alerts for failures, freshness violations, and custom conditions via Slack, email, or incident management tools
Unified orchestration and observability: Combines scheduling, retries, backfills, and monitoring in a single platform to reduce operational complexity
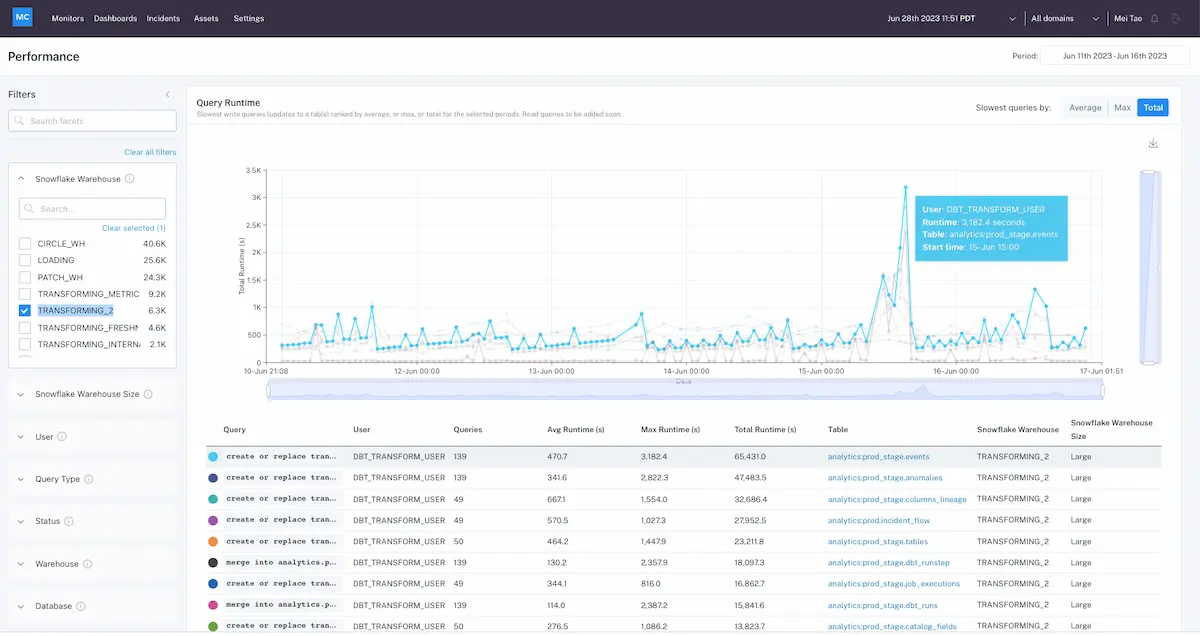
2. Monte Carlo

Monte Carlo is a data observability platform that monitors the health and reliability of data pipelines, systems, and AI workloads. It unifies observability across traditional data infrastructure and AI models, helping teams address the growing trust gap between data quality and AI reliability.
Key features include:
- End-to-end observability: Tracks data from ingestion through transformation to consumption and AI output, helping detect both pipeline failures and AI drift or bias
- Integrated monitoring for data and AI: Observes pipeline reliability, data completeness, and timeliness alongside model behavior and output quality
- Automated issue detection: Identifies anomalies across datasets and models without relying on manual checks or siloed monitoring tools
- Root cause analysis across domains: Diagnoses whether issues stem from data pipelines, system infrastructure, or model behavior
Improved collaboration: Aligns data, AI, and business teams by providing a shared view of health and performance across the stack
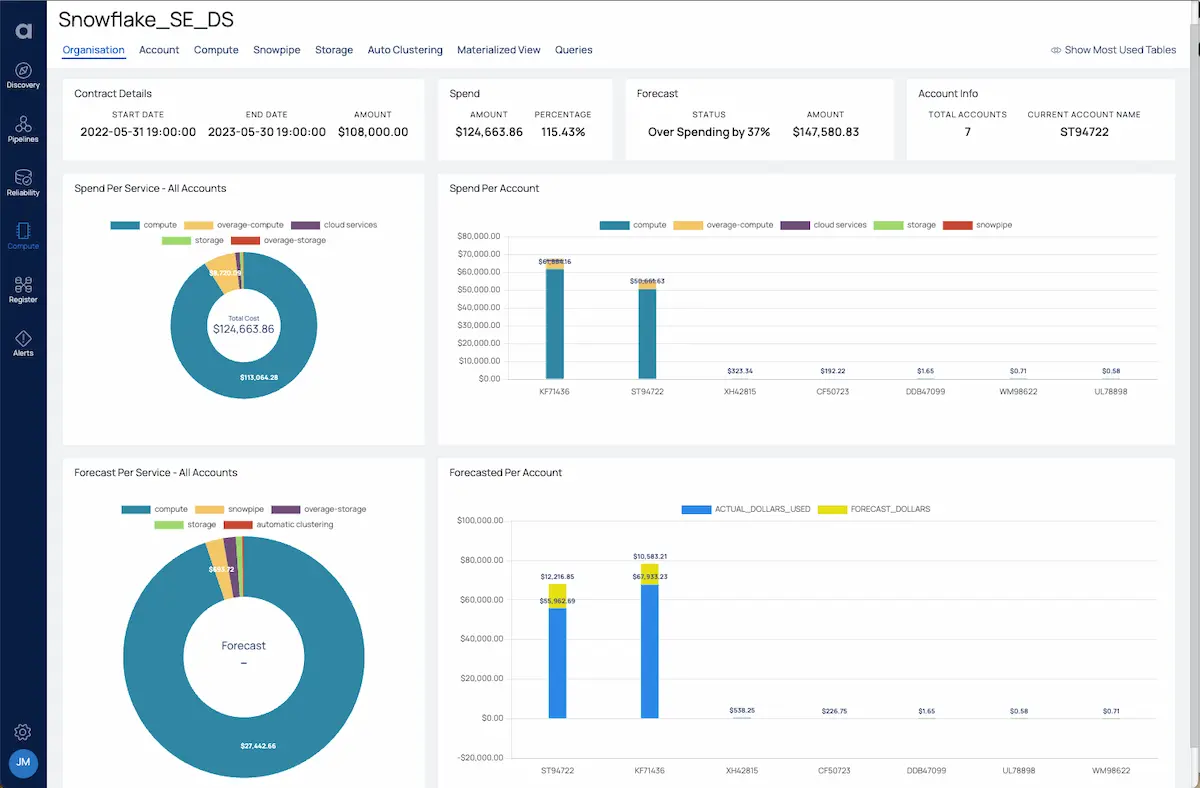
3. Acceldata

Acceldata is a data observability platform that introduces agentic data management (ADM), an AI-driven approach that unifies monitoring, governance, and optimization across the modern data stack. Unlike traditional solutions that treat data quality, lineage, and profiling as isolated functions, Acceldata uses agents to manage these dimensions in a coordinated and autonomous manner.
Key features include:
- AI-powered data agents: Autonomous agents handle core observability tasks (quality, lineage, and profiling) using contextual intelligence to optimize decisions and prevent failures
- Data quality agent: Monitors and resolves data quality issues, ensuring reliable data for analytics and AI use cases
- Data lineage agent: Tracks data movement across systems, enabling root cause analysis, dependency mapping, and informed change management
- Data profiling agent: Surfaces anomalies, schema issues, and statistical insights from datasets to strengthen governance and improve data usability
Unified agentic architecture: Integrates multiple observability domains under a single AI-driven framework for holistic, automated data management
4. Soda
.webp)
Soda is a data observability platform intended to move teams from reactive issue detection to proactive data quality prevention. It combines monitoring with early-stage testing and collaborative workflows to ensure data issues are caught before they impact production. It shifts observability left into CI/CD pipelines and enables contract-based collaboration between data producers and consumers.
Key features include:
- Metrics observability: Detects anomalies in production data using an engine that is faster and more accurate than traditional Prophet-based models
- Pipeline testing: Integrates directly into CI/CD workflows, allowing teams to validate data early and prevent low-quality data from reaching production
- Collaborative data contracts: Converts identified anomalies into data contracts, aligning expectations between producers and consumers without requiring code changes
- Operational data quality management: Automates issue routing to the appropriate data owners and simplifies resolution workflows to minimize downtime
Explainable alerts: Sends context-rich notifications with low false positives, helping teams understand, prioritize, and act on data issues quickly
.webp)
5. Sifflet

Sifflet is an AI-augmented data observability platform for technical teams and business users. It combines automated monitoring, lineage tracking, and data cataloging into a unified solution that promotes transparency, accountability, and collaboration across the organization. It enablies all stakeholders to understand, monitor, and trust their data.
Key features include:
- AI-augmented monitoring: Delivers out-of-the-box and customizable monitoring, powered by AI to reduce noise, prioritize critical issues, and optimize coverage over time
- Data lineage and tracing: Maps upstream and downstream dependencies to help teams quickly identify the origin of data issues and assess their impact
- Data catalog: Simplifies data discovery with an automated, searchable catalog that supports collaboration and improves understanding of available assets
- Business-ready interface: Built with both engineers and business users in mind, making it easy for non-technical teams to participate in monitoring and data ownership
Self-serve and collaboration: Allows users to view data health, contribute to monitoring rules, and take responsibility for their data, supporting data mesh initiatives
.webp)
6. Bigeye

Bigeye is an enterprise-grade data observability platform to support modern and legacy data stacks at scale. By combining integration coverage with lineage-enabled workflows, Bigeye helps data teams detect, diagnose, and resolve data issues before they affect business outcomes. It includes automated monitoring, root cause analysis, and data health summaries.
Key features include:
- Lineage-enabled observability: Leverages column-level data lineage to trace dependencies, pinpoint root causes, and assess downstream impact with speed and precision
- Comprehensive stack coverage: Supports both legacy and modern infrastructure with over 50 connectors, including cloud, on-premises, and hybrid deployments
- Automated root cause & impact analysis: Simplifies investigation workflows, enabling teams to prioritize and resolve high-impact issues faster
- Data health summaries for business users: Delivers intuitive dashboards and BI-integrated summaries so stakeholders can monitor and trust the data they rely on
Proactive monitoring: Automatically maps critical business fields and deploys targeted upstream monitoring to track only what matters
.webp)
7. Anomalo
.webp)
Anomalo is a scalable data observability platform built to automatically monitor data quality, reliability, and freshness across data warehouses without requiring deep configuration. It uses AI-based checks, rules-based validations, and metrics monitoring to detect anomalies in table-level data and catch pipeline issues before they impact business outcomes.
Key features include:
- Automated table monitoring: Continuously tracks availability, freshness, and row counts across every table to catch issues like late updates or missing data
- AI-powered anomaly detection: Uses machine learning to identify unexpected changes in data values, catching subtle issues traditional monitoring might miss
- Custom rules and metrics monitoring: Supports SQL-based validations and metric tracking for critical tables to match business-specific quality expectations
- Data pipeline monitoring: Detects pipeline failures such as dropped tables, delayed jobs, or incomplete data loads before they affect downstream models or dashboards
Governance and compliance support: Enables warehouse-wide oversight, integrates with data catalogs, and provides dashboards for quality initiatives and audit reporting
.webp)
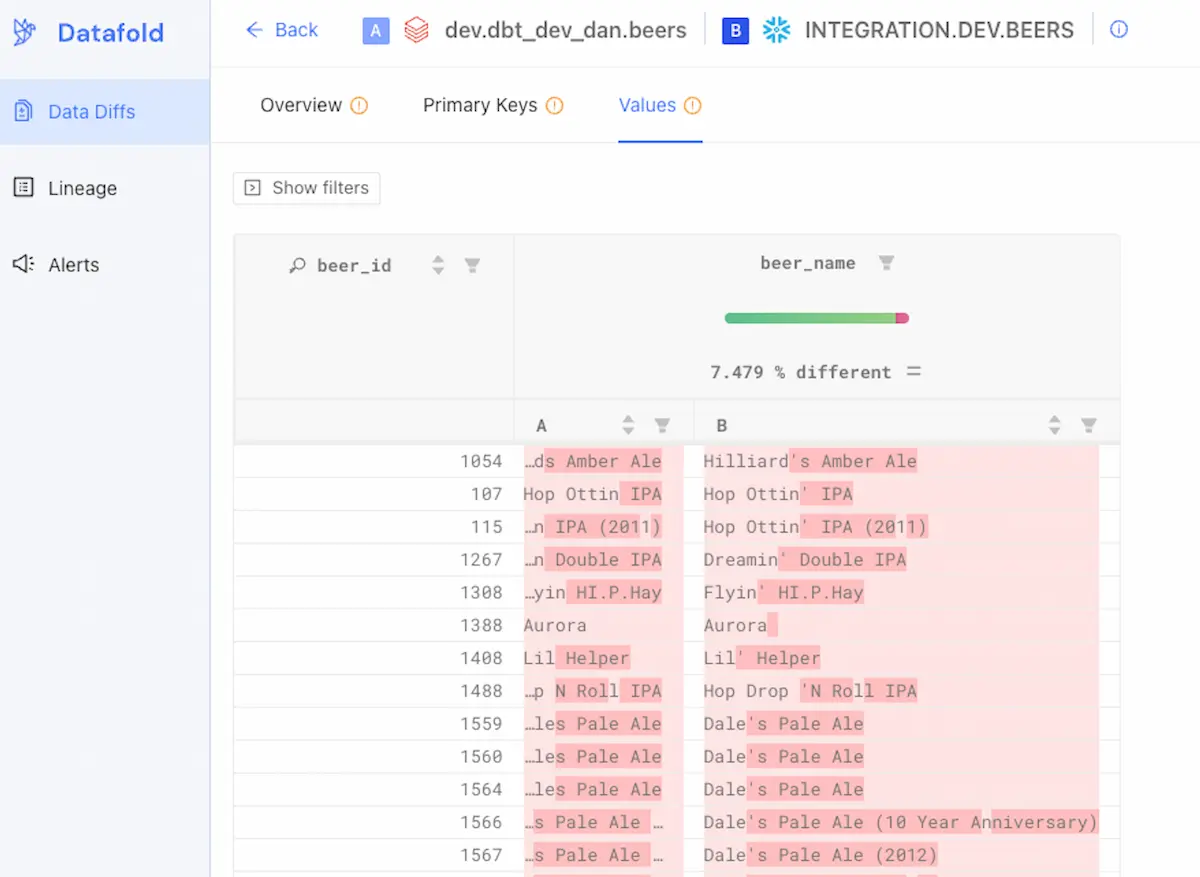
8. Datafold

Datafold is a data observability solution focused on proactive, upstream data monitoring to catch issues before they impact downstream processes. By moving observability “left” in the data lifecycle, Datafold helps teams detect data quality problems during development, deployment, or integration phases, minimizing risk and reducing incident response time.
Key features include:
- Data diffs: Compares data between source and destination systems to ensure value-level consistency, reducing the risk of silent data divergence in pipelines
- Metrics monitoring: Uses machine learning to detect anomalies in key indicators like row counts, freshness, and uniqueness, helping teams catch issues early
- Custom data tests: Allows users to define validation rules for business-critical logic, such as identifying nulls, duplicates, or invalid values at the record level
- Schema change alerts: Notifies teams instantly of unexpected changes in table structures or column types, preventing breakages in downstream jobs or dashboards
CI/CD integration: Embeds into development workflows with support for real-time alerting via Slack, PagerDuty, and other tools to catch and resolve issues during code changes
Considerations for Choosing the Right Data Observability Tool
Selecting the right data observability platform requires careful evaluation of your organization’s data environment, team structure, and operational goals. While many tools offer similar core features, key differences in scope, flexibility, and ecosystem compatibility can significantly affect value and effectiveness. Below are critical considerations to guide your decision:
- Depth of integration with existing stack: Ensure the tool supports your current and planned data sources, warehouses, transformation layers, and BI platforms. Tools that integrate natively with your tech stack minimize setup time and maximize observability coverage.
- Support for real-time vs. batch workloads: Some tools excel in streaming and real-time monitoring, while others are optimized for batch pipelines. Choose based on the nature and criticality of your workflows, especially if latency or near-real-time alerting is a priority.
- AI and automation capabilities: Evaluate the tool’s ability to automate anomaly detection, root cause analysis, and remediation. Platforms with ML or AI agents reduce manual oversight and scale better in complex environments.
- Ease of use for technical and non-technical users: Consider whether the interface, dashboards, and alerting systems are accessible to both engineers and business stakeholders. Broad usability supports data ownership across the organization.
- Customization and flexibility: Look for tools that allow custom rules, tailored alerts, and flexible metric tracking. This ensures alignment with unique data quality policies and operational SLAs.
- Scalability and performance: Assess how well the platform performs as data volumes and pipeline complexity grow. High-performance tools should maintain observability without significantly increasing infrastructure overhead or lag.
- Security, compliance, and governance alignment: The tool should align with your organization's compliance needs, offering audit logs, role-based access control, and integration with data catalogs or policy engines where needed.
- Pricing model and cost predictability: Review how the tool charges: by number of tables, data volume, usage hours, or users. Unpredictable pricing can lead to hidden costs at scale, especially in fast-growing data environments.
By mapping these considerations to your technical needs and organizational goals, you can choose a data observability solution that delivers measurable value without unnecessary complexity.


.jpg)
.png)


.png)

