Deliver high-quality data with Dagster Asset Checks, the ability to embed data quality checks into your data pipeline.
Data orchestrators help data engineers deliver data, and they help organizations understand that data: where it comes from, where it’s used, and whether it’s up-to-date.
But delivering garbage data on time is often worse than delivering no data at all.
To truly support the job of data engineering, data orchestrators need to help deliver high-quality data and help organizations understand the quality of that data. To do this, data orchestrators need to understand data quality checks.
Dagster’s recent 1.5 release includes “Asset Checks”, a new feature that offers the ability to define data quality checks that target Dagster assets. Asset Checks answer a theme of feature requests that we’ve been receiving for years, and they represent the culmination of a multi-month open design process, with dozens of comments from members of the Dagster community.
In this post, we’ll summarize why we believe data quality checks should be tightly integrated with orchestration, then survey Dagster Asset Checks and how they help data engineers deliver high-quality data.
Data quality checks and orchestration
In most data platforms, data quality checks don’t exist, or they’re managed in tools siloed from the orchestrator. We believe that this makes operating data pipelines and the data platform at large significantly more difficult than it needs to be. Data quality must be a first-class orchestration feature, for a few reasons:
- Data pipeline health all in one place - Orchestrators are already the source of truth on what succeeded, what failed, and where data comes from and goes to. If the orchestrator also understands when data fails its quality checks, it’s uniquely able to provide a full picture of the health of each data asset, and the pipeline as a whole.
- Data quality checks are work, and work needs to be orchestrated - Without an orchestrator, it’s difficult to know when checks are executed, to make sure work happens in the right order, and to pick up where you left off when there’s a failure. It’s easy to execute checks too often or not often enough.
- Orchestrate based on check results: stop bad data from spreading - When data doesn’t meet your quality bar, often you don’t want to let it spread to downstream assets in your pipeline. An orchestrator that understands data quality checks can skip downstream computations when upstream checks don’t pass.
- Declarative data quality checks as part of an asset’s contract - With the software-defined asset approach, the orchestrator is a source of truth on what data assets make up the pipeline. It’s natural to extend this so that the orchestrator understands what data quality checks are defined for each asset. It can then present a reliable, unified view of what the data in the pipeline intended to look like, which acts as a shared point of reference for data pipeline developers and stakeholders.
In short, when data orchestration is siloed from data quality, it’s difficult to get a grip on the health of your data pipeline, painful to track all the activity happening inside your data platform, and nearly impossible to coordinate data quality checks with data updates.
Introducing Dagster Asset Checks
As a data orchestrator, Dagster’s fundamental abstraction is the Software-defined Asset: a description, in code, of an asset that should exist and how to produce and update it. Dagster enables building data pipelines by defining graphs of assets.
In Dagster 1.5, we introduced a new abstraction that goes hand-in-hand with software-defined assets: the Asset Check. Each Asset Check verifies some property of a Dagster data asset, for example, that it has no null values in a particular column. Here’s sample Python code that demonstrates how to define a Dagster asset and corresponding Asset Check:
Note that writing data quality logic from scratch in Python is just one way to use Dagster’s data quality APIs. In many data platforms, these APIs will instead wrap tools like dbt tests, Great Expectations, or organization-specific DSLs for specifying data quality constraints.
A unified view of pipeline health
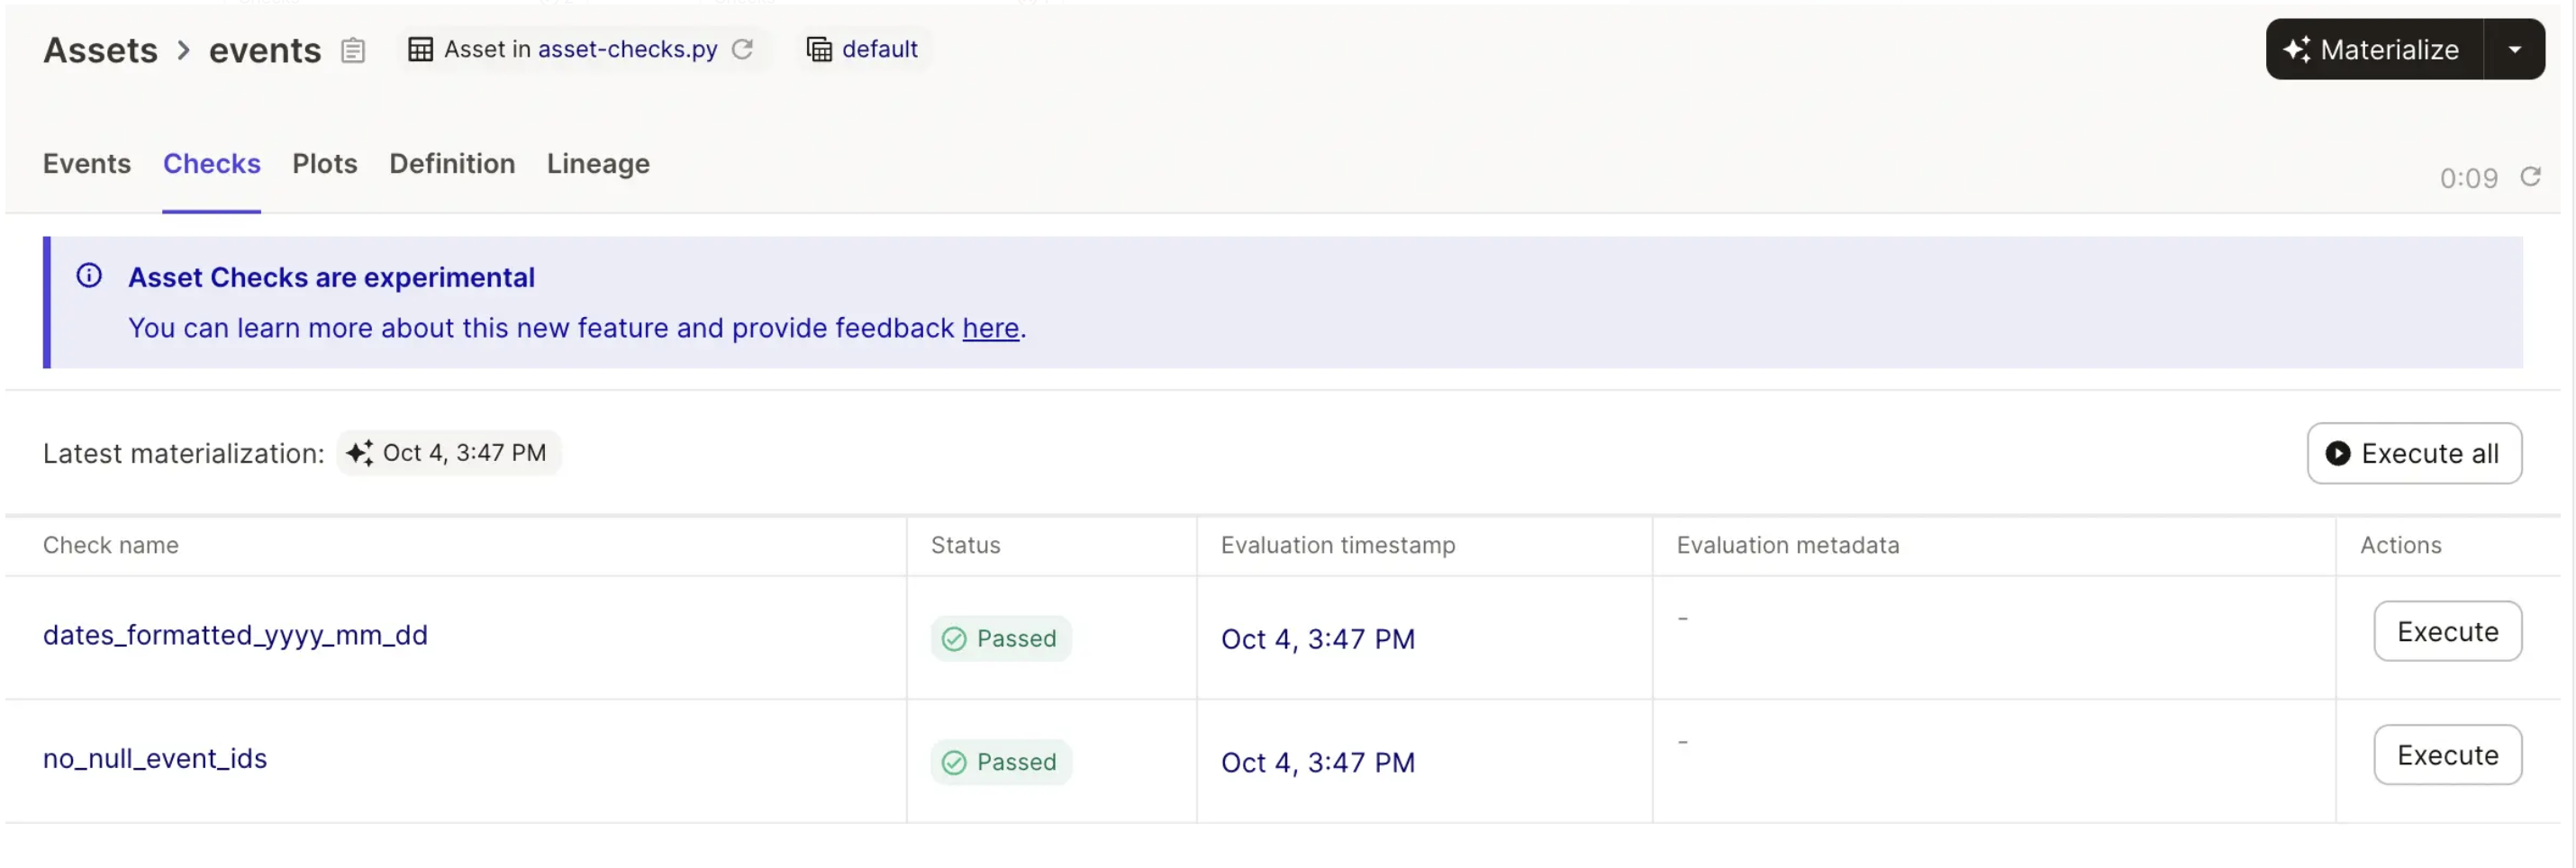
Asset Checks enable Dagster to expose a unified view of pipeline health. Dagster’s asset graph UI can tell you both whether assets have been materialized successfully and whether their checks have passed.

When viewing an asset in Dagster’s UI, you can see all of its checks, and whether they’ve passed, failed, or haven’t run. This means a single place to go to discover and learn about issues in your data pipeline, whether it’s data quality checks that aren’t passing, errors that are causing materializations to fail, or data that’s more outdated than expected.
Asset Checks and alerting
When an asset check fails, often you want to receive an email or Slack message, so you can investigate. Dagster Cloud’s alerting system now allows you to subscribe to alerts that inform you about failed checks.
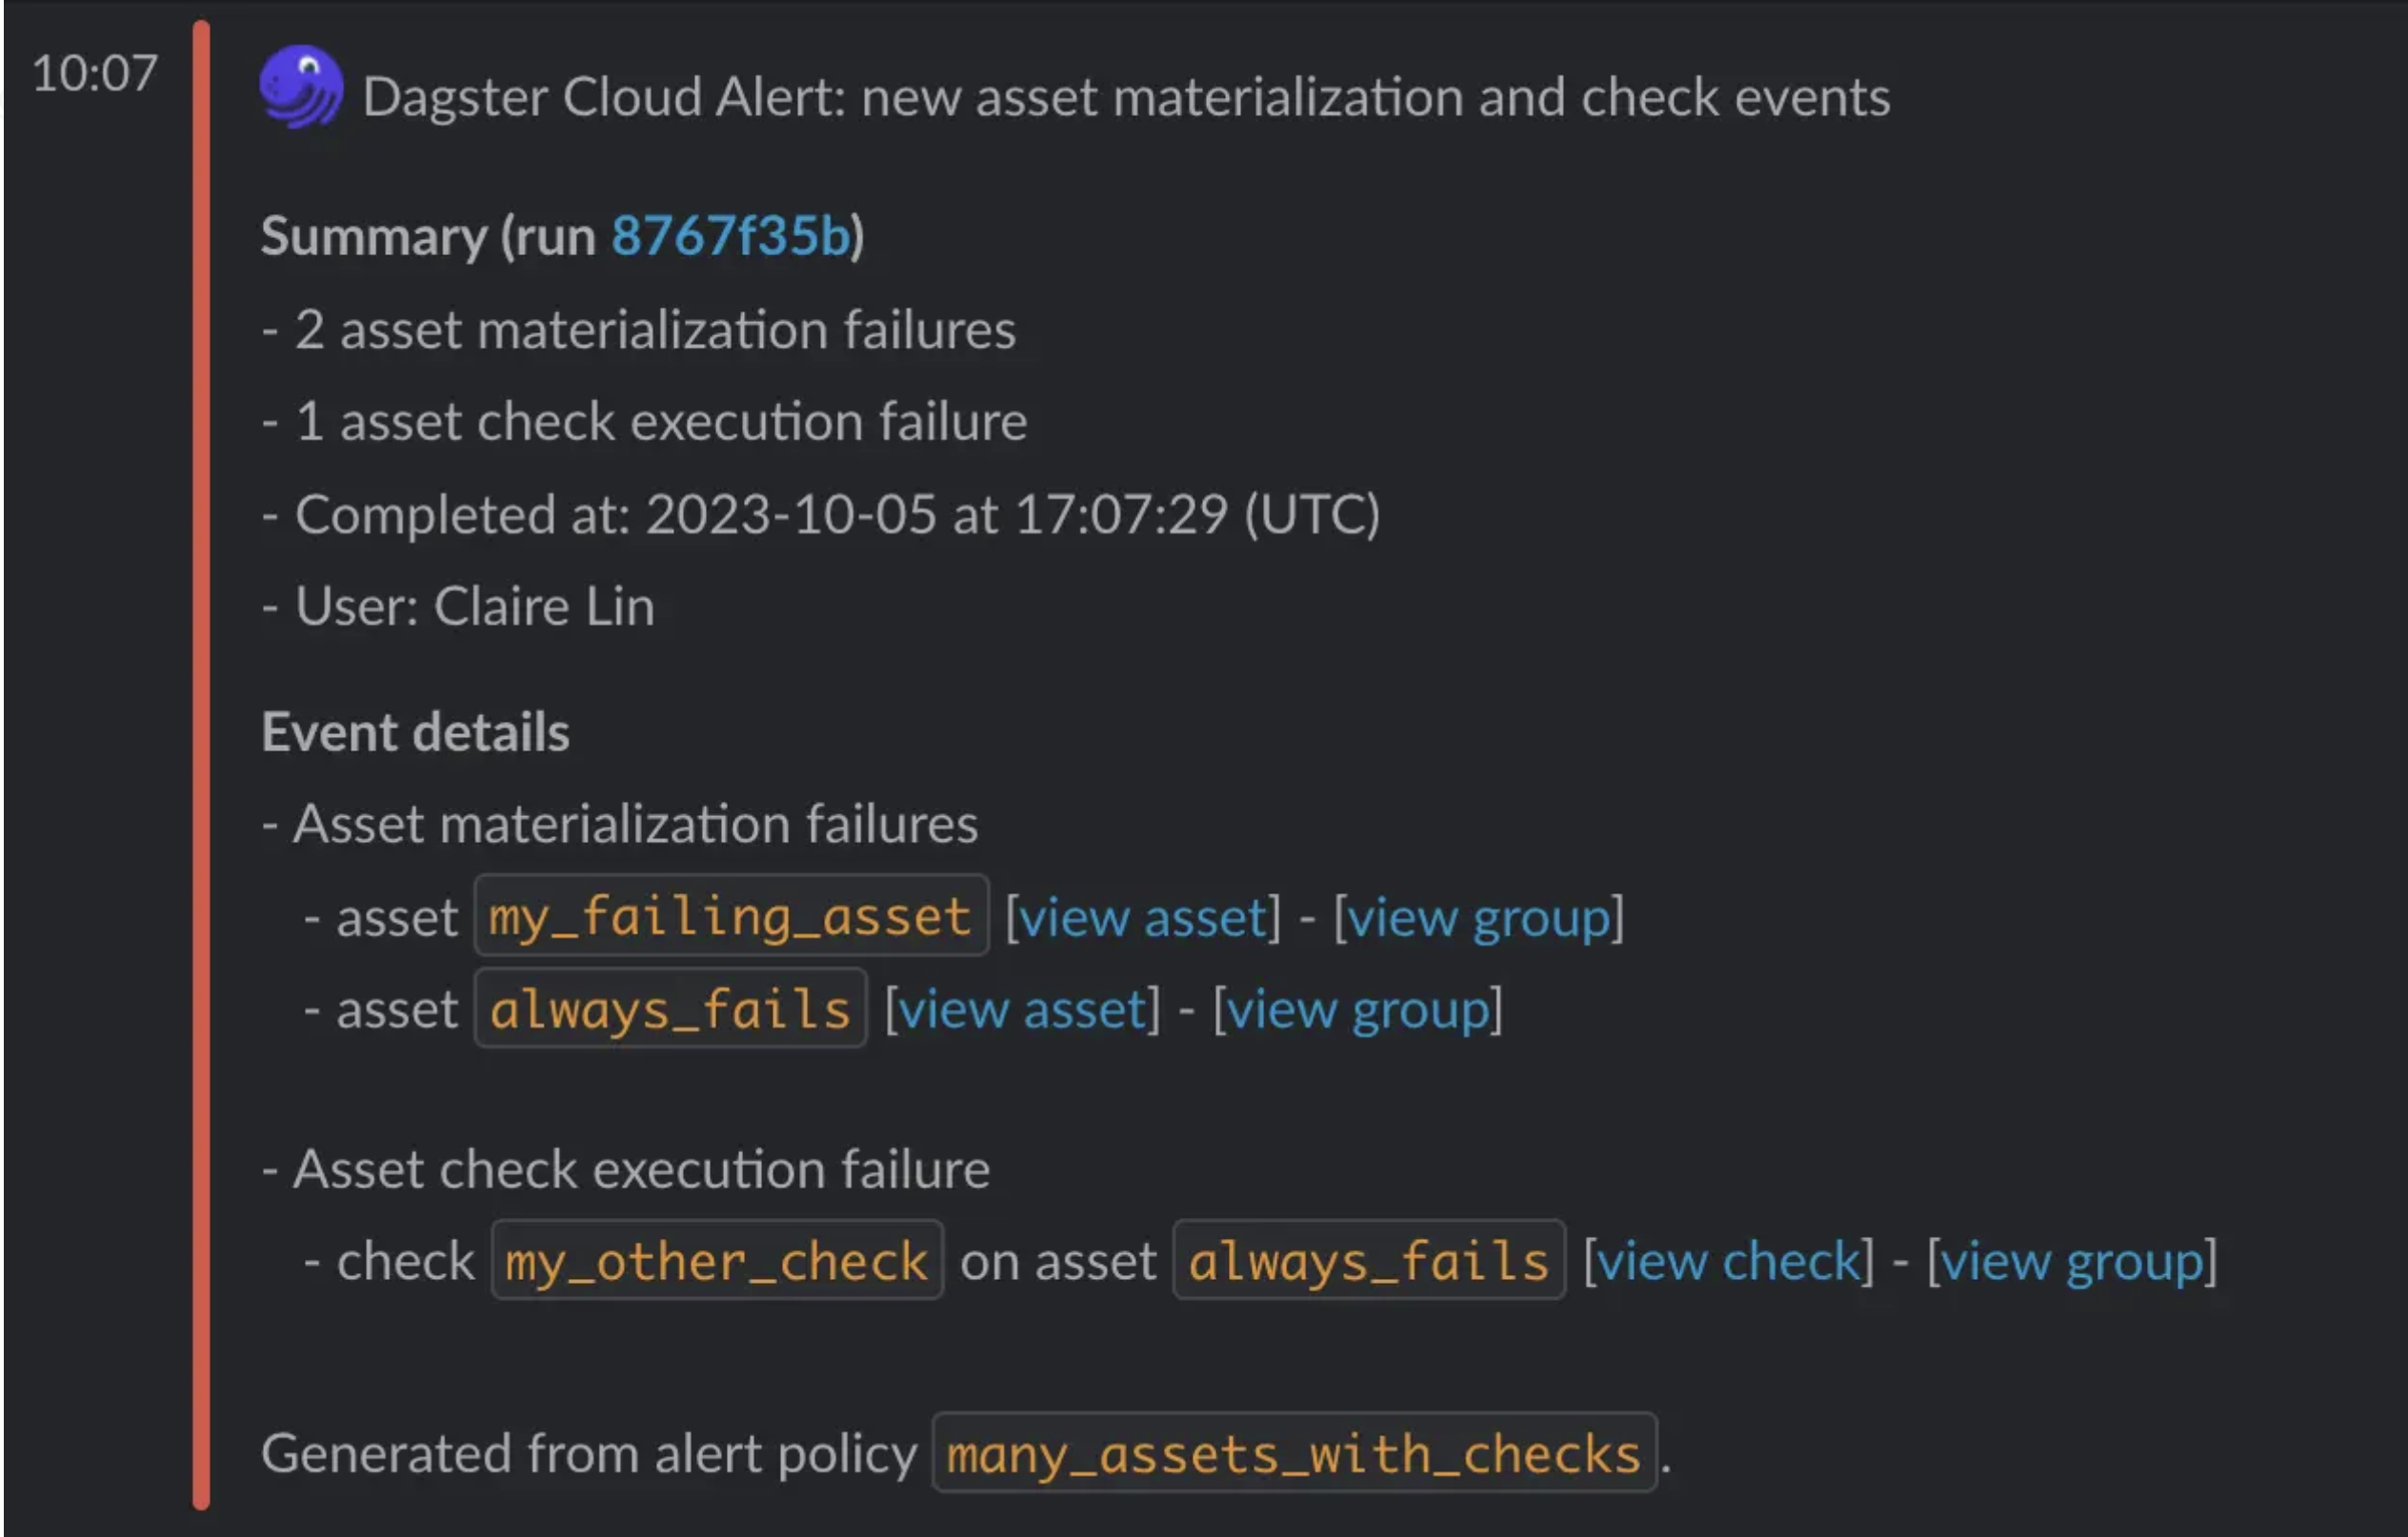
In open source deployments, you can write a sensor that checks for failed asset checks in the Dagster event log and invokes code to alert on them.
Flexible execution: inline with the pipeline or on their own
Checks can be executed from Dagster, either inline with the data pipeline that includes the assets they’re checking, or on their own. Executing inline with assets makes it easy to execute checks whenever data changes, as well as to stopping data that fails checks from spreading downstream. Executing them on their own allows finer-grained control: for example, if you update data frequently, but your check is expensive, you might want to run the check independently from the data updates.
Data quality checks can run in their own steps, or they can run in the same step that generates the asset that they’re checking.
Asset Checks vs. software-defined assets
In many ways, Asset Checks function like software-defined assets themselves: they can be flexibly scheduled, they operate on assets, and they’re declared in code. The core difference is that they affect the status of the assets they check, rather than acting as their own nodes in the lineage graph.
Asset Checks as data contracts
The fact that Dagster can display checks as soon as they’re defined, even if they haven’t run yet, makes them a way of communicating data contracts. You can navigate to the page for a Dagster asset to understand what properties its owners expected it to satisfy.
What this all amounts to is that you end up with a single system that can:
- Understand and communicate what data is expected to exist, how it’s partitioned, how fresh it’s expected to be, under what circumstances it should be updated, and which team owns it (asset definitions)
- Execute and track updates to that data (asset materializations)
- Understand and communicate what that data should look like (Asset Check definitions)
- Execute and track computations that verify that it looks like that (Asset Check executions)
When you encounter an asset in the wild, you can refer to this system to get a reliable picture of what to expect from it: what its author intends it to look like, compared with the reality of what it actually looks like.
Asset Checks and dbt tests
Just as any dbt model can be understood as a software-defined asset, any dbt test can be understood as an Asset Check.
When loading a dbt project into the asset graph, Dagster’s dbt integration can now load all dbt tests as Asset Checks. This makes it much easier to visualize the success and failure of those tests, as they now show up on the Dagster asset that corresponds to the dbt models that they’re checking.
It also allows you to kick off individual dbt tests from Dagster’s UI.
Asset Checks and anomaly detection
It’s often difficult to come up with a hard threshold for bad data that merits a check failure and subsequent alert. Because of this, many practitioners prefer to instead write data quality checks that fail when the numbers are significantly different than what’s been observed in the recent past.
Dagster facilitates this pattern with its asset materialization metadata system. Each time you materialize an asset, you can attach a dictionary of arbitrary metadata to it. For example, you can include a count of the number of records that have a null value in a particular column.
You can write Asset Checks that access the metadata for historical materializations from Dagster’s event log. This allows you to compare the current number of null records to the number of null records in recent materializations, and fail if the current value appears anomalous.
Data quality checks vs. other data quality patterns
Data quality checks are an important pattern for ensuring that data is high quality. However, they’re not the only pattern. Dagster has functionality that’s helpful for handling some of the other patterns as well.
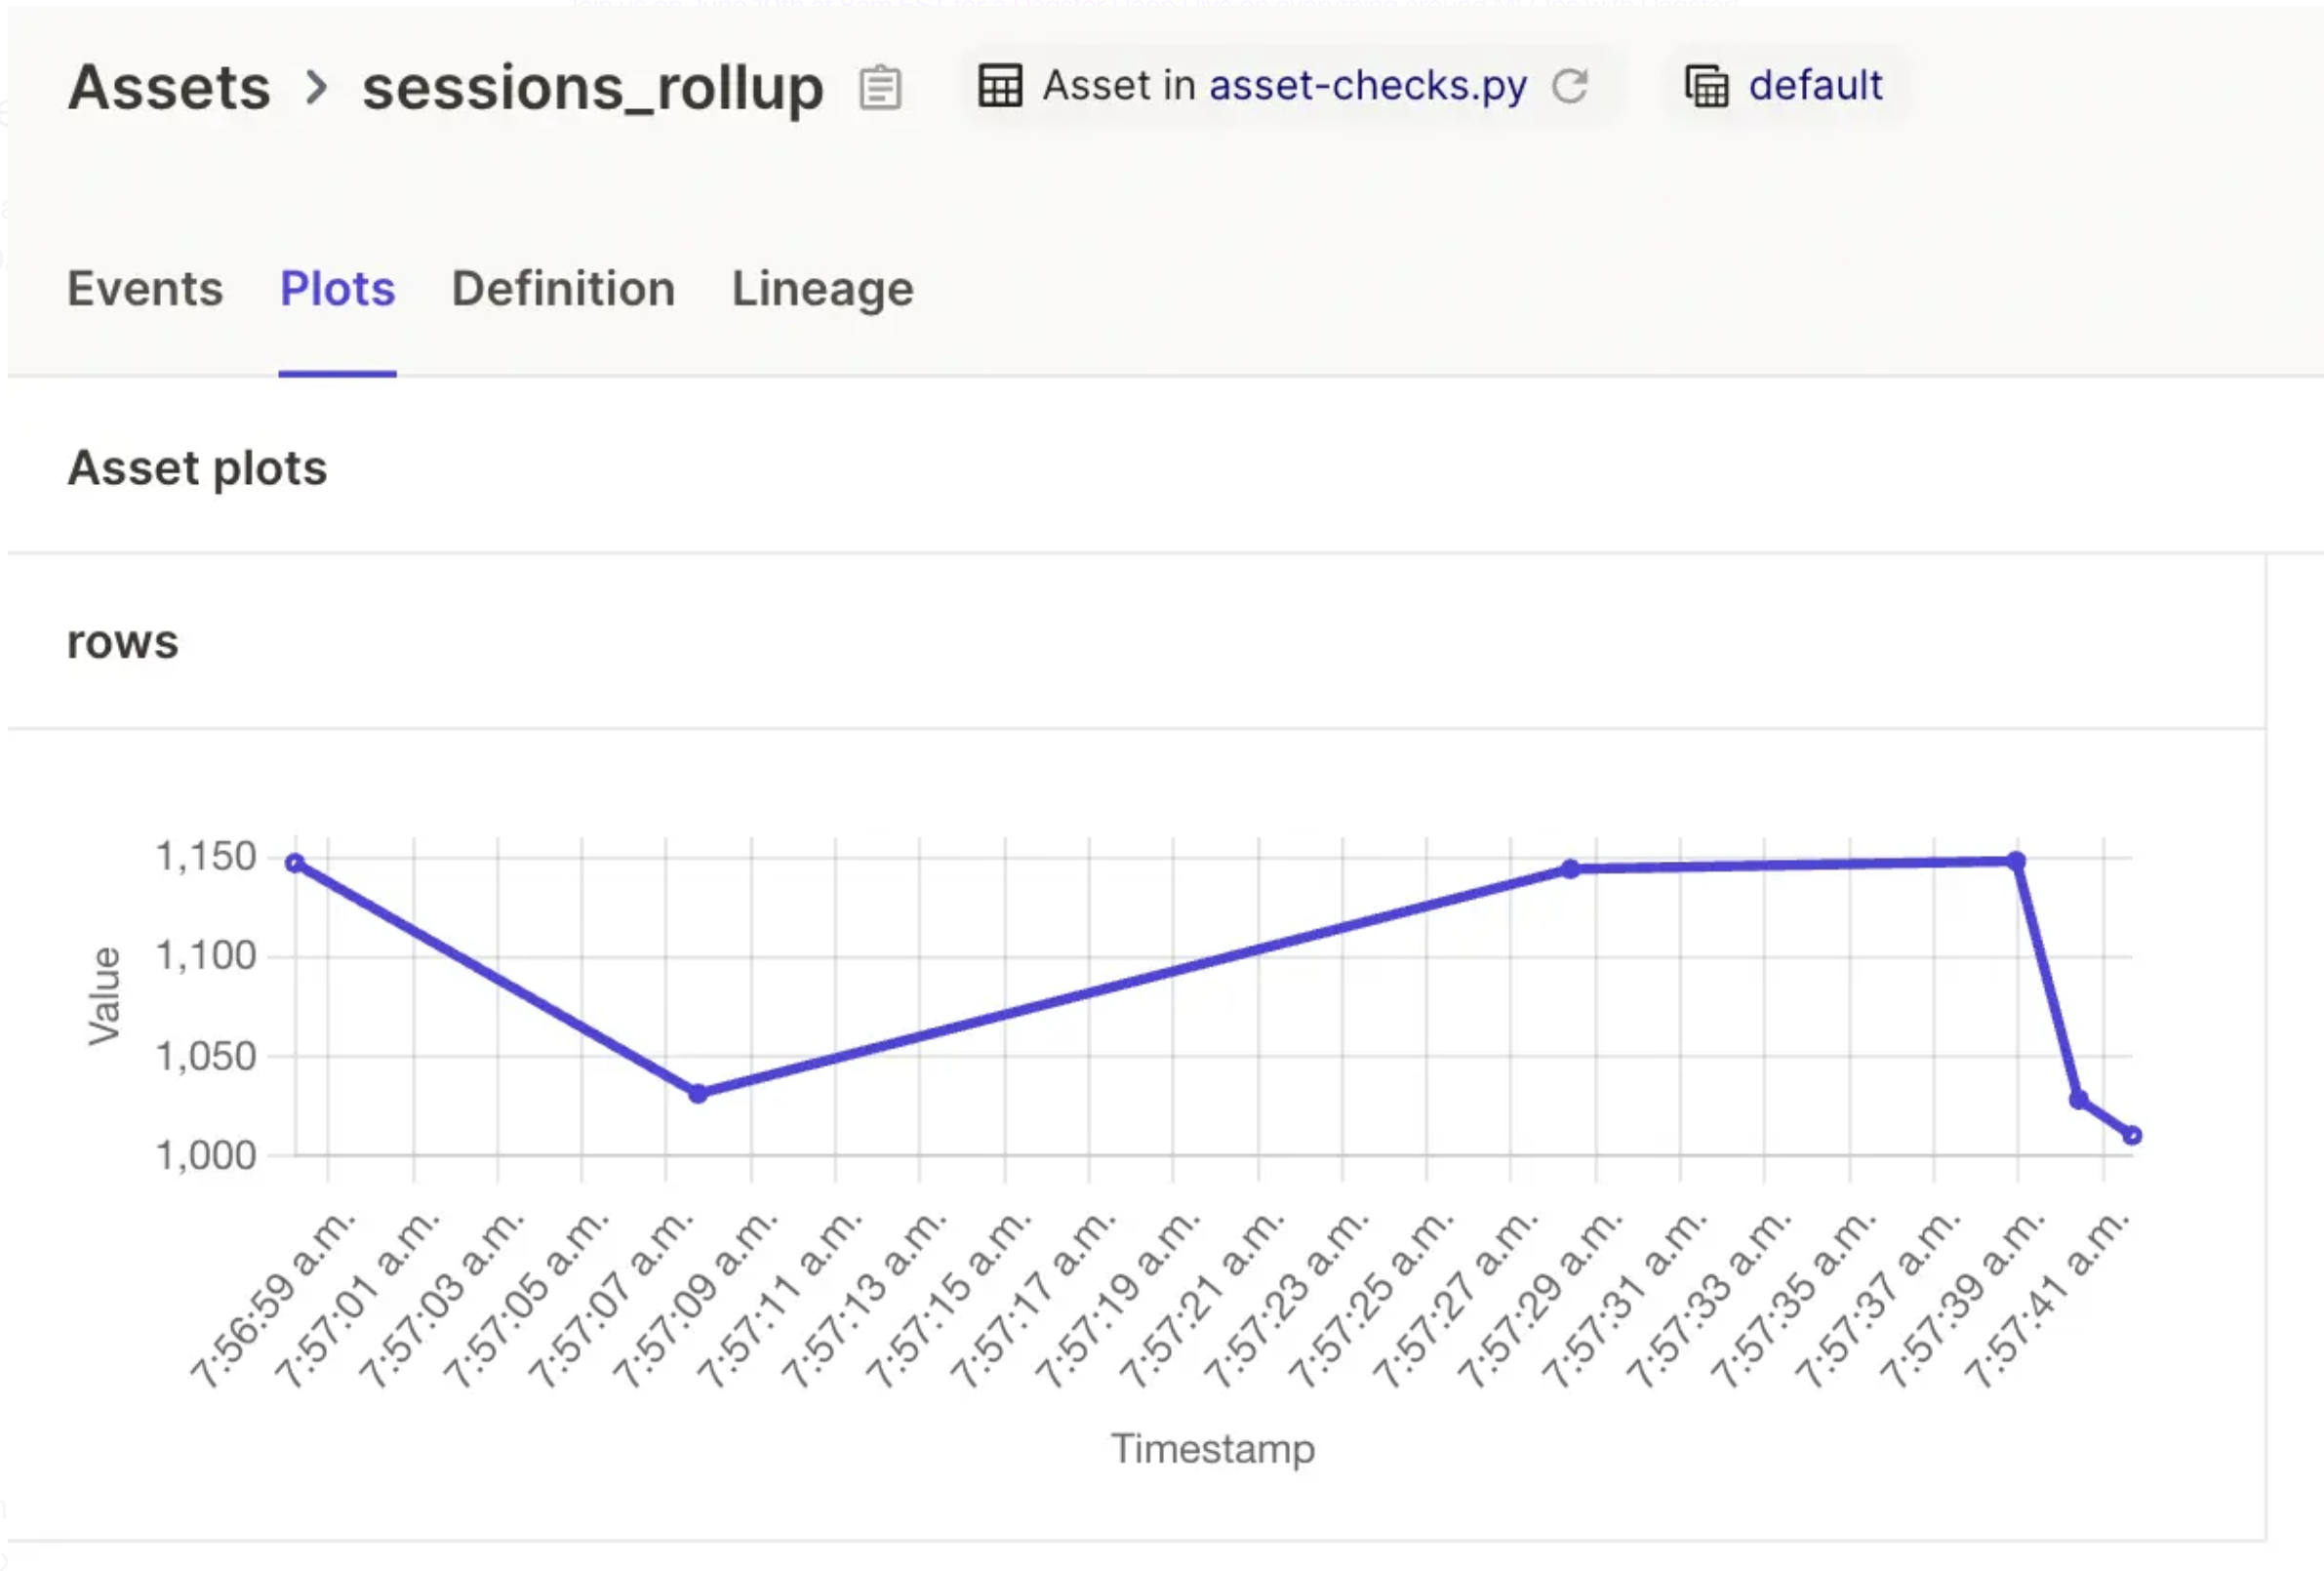
In some cases, it’s useful to just track data quality metrics, without setting any particular threshold for alerting. For example, you might want to record the number of null rows in your dataset every time you materialize it, and have access to a chart that indicates how that number has changed over time. Dagster’s asset materialization metadata functionality enables implementing this: you can attach arbitrary metadata to each asset materialization, and, if that metadata is numeric, Dagster will plot it on the asset page:
In other cases, you might want to generate a full data quality report at the end of your pipeline. For example, a PDF or spreadsheet or HTML or Great Expectations Data Doc that reports on the quality of multiple assets in your pipeline. The best way to implement this in Dagster is to model this report as its own data asset, which depends on the assets that it’s reporting on.
Try it out!
Asset Checks are part of Dagster’s latest big release – Dagster 1.5. To learn how to take them for a spin, check out the docs. Or if you’re using dbt, a better place to start is the reference section on how to load your dbt tests as Asset Checks.
Note that Asset Checks are currently an experimental feature, and the API may change in future releases. During this period, checks do not consume Dagster Cloud credits.
As always, we’d love to hear your use cases and your feedback: in the #data-quality-asset-checks channel in our Slack, or as discussions or issues in Github.
Learn more about Asset Checks in the Dagster Docs.


.jpg)
.png)
.jpg)

.png)
