


DataOps is about building a system that provides visibility into what's happening and control over how it behaves
DevOps gave us CI/CD. DataOps gives us data we can actually trust.
If you haven't heard of so-called “DataOps” before, you are probably already doing pieces of it. You've got schedules, you've got tests, maybe you've got some alerting. But DataOps is about bringing all of these together into a cohesive system that provides visibility into what's happening and control over how it behaves.
Think of it in two phases. Day 1 is the developer experience or how you build, test, and ship pipeline code. Day 2 is the operational layer or how your pipelines behave in production once they're running. Most orchestrators focus on one or the other. Dagster covers both.
Day 1: Developer Experience
Before you can have reliable data in production, you need a reliable way to build and ship pipeline code. This is where Dagster's developer experience really shines. It brings the same development workflow application engineers have had for years to data teams.
The dg CLI is your starting point. It greatly simplifies the ergonomics of building with Dagster. For example, dg dev launches a full local Dagster instance with UI in one command, dg scaffold generates assets with zero boilerplate, dg check validates your definitions before you push, and dg list lets you introspect everything without spinning up the UI. Having this functionality is useful for LLM coding agents. When you pair Claude code or Codex with our official Dagster plugin and skills, you can ship more confidently without having to be a Dagster expert since we have encoded that knowledge for you.
Once your code is ready, branch deployments in Dagster+ close the gap between local dev and production. Every pull request automatically spins up a fully functional Branch Deployment, an ephemeral copy of your data platform. Open a PR, get an isolated environment, validate under production-like conditions, and merge with confidence. Branch deployments include change tracking that highlights which assets were modified, making code review far more meaningful. You can even configure them to clone production databases and run materializations against real data schemas.
Day 2: DataOps in Production
DataOps is the practice of applying DevOps principles to data: automation, monitoring, reliability, and collaboration. Ultimately its about predictability and minimizing the amount of negative surprises.
The core principles:
- Reliability: Can your pipelines recover from failure gracefully?
- Quality: Is the data that lands actually correct?
- Visibility: Can you and your stakeholders see what's going on without digging through logs?
These are tangible engineering problems with specific solutions.
Reliability
Pipelines fail. APIs time out, databases go down, and rate limits get hit. A reliable data platform doesn't prevent every failure; it recovers automatically and gives you controls to manage how work gets processed.
Automatic Retries
The simplest reliability improvement is enabling automatic retries in your dagster.yaml:
run_retries:
  enabled: true
  max_retries: 3
  retry_on_asset_or_op_failure: true
Any run that fails is picked up and retried without manual intervention. This covers a huge class of transient failures: network blips, rate limits, and brief connection issues. By default, retries use a FROM_FAILURE strategy that skips successful steps and re-executes only from the point of failure, so you're not wasting compute re-running work that already succeeded.
You can override retry settings per job with tags like dagster/max_retries and dagster/retry_strategy, and Dagster also supports op-level retries with exponential backoff for step-level transient failures. One tip: if you enable both, set retry_on_asset_or_op_failure: false at the instance level so run retries handle only infrastructure failures (like crashed workers) while op retries handle step-level issues. For the full breakdown, see configuring run retries.
Concurrency Controls
Concurrency controls prevent failures before they happen. If your Redshift cluster can only handle a few concurrent connections, a burst of runs can overwhelm it. Without guardrails, you're essentially DDoS-ing your own warehouse.
run_queue:
  max_concurrent_runs: 15
  tag_concurrency_limits:
    - key: 'database'
      value: 'redshift'
      limit: 4
    - key: 'dagster/backfill'
      limit: 10
This says: run at most 15 concurrent runs total, but only 4 can target Redshift at once, and backfills are capped at 10. Runs that exceed a tag limit wait in the queue instead of failing. On Dagster+, you configure this in your deployment settings. For more, see managing concurrency.
Run Priority
If you've ever had to worry about launching a big backfill because it would bottleneck production jobs, this is for you.
Dagster processes runs first-in-first-out by default, but you can override that with the dagster/priority tag (higher numbers run first, negative numbers de-prioritize):
@dg.job(tags={"dagster/priority": "5"})
def critical_production_job(): ...

@dg.schedule(
    cron_schedule="0 * * * *",
    job_name="backfill_job",
    tags={"dagster/priority": "-1"},
)
def low_priority_backfill(_): ...
Combine priority with tag concurrency limits and production always runs first while backfills take only a couple of queue slots. No more weekend backfills blocking Monday morning dashboards. One important detail: a run blocked by tag concurrency limits won't block unrelated lower-priority runs. For details, see customizing run queue priority.
Run Timeouts
Sometimes, runs that start but never finish silently consume resources until you manually intervene. Run monitoring catches them:
run_monitoring:
  enabled: true
  max_runtime_seconds: 7200  # 2 hours
  start_timeout_seconds: 180
  max_resume_run_attempts: 3
Any run exceeding the max runtime gets marked as failed. You can override per job with the dagster/max_runtime tag, maybe your warehouse refresh gets 4 hours while API ingestion gets 10 minutes:
@dg.job(tags={"dagster/max_runtime": 14400})  # 4 hours
def nightly_warehouse_refresh(): ...

asset_job = dg.define_asset_job(
    name="api_ingestion",
    selection="*",
    tags={"dagster/max_runtime": 600},  # 10 minutes
)
Dagster Insights helps you find the right limits by showing 99th percentile runtimes, so you can set tight but realistic guardrails based on actual performance data.
The monitoring daemon can also detect crashed run workers (like evicted K8s pods) and automatically resume them. See run monitoring for more.
Backfill Strategies
When you need to reprocess 100 days of data, Dagster gives you three strategies via BackfillPolicy:
One line of config takes you from 100 runs to 10, and on Dagster+, that also means reduced credit usage since credits are counted per run:
@dg.asset(
    partitions_def=daily_partitions,
    backfill_policy=dg.BackfillPolicy.multi_run(max_partitions_per_run=10),
)
def daily_events(context: dg.AssetExecutionContext):
    ...
See backfill strategies for the full comparison.
Quality
Reliability gets your pipelines running. But the data has to be right, too. A pipeline that consistently delivers wrong data is arguably worse than one that fails loudly, because stakeholders lose trust without understanding why. It's much easier to tell someone "the data is stale because we caught an issue" than "the data has been wrong for three days and we just noticed." Trust is easy to lose and hard to win back.
Asset Checks
Asset checks are data quality tests tied directly to your assets. They run after materialization and show up in the UI next to the asset they're checking:
@dg.asset_check(asset=orders, blocking=True)
def orders_id_has_no_nulls():
    orders_df = pd.read_csv("orders.csv")
    num_null_order_ids = orders_df["order_id"].isna().sum()
    return dg.AssetCheckResult(
        passed=bool(num_null_order_ids == 0),
        severity=dg.AssetCheckSeverity.ERROR,
        metadata={"null_count": int(num_null_order_ids)},
    )
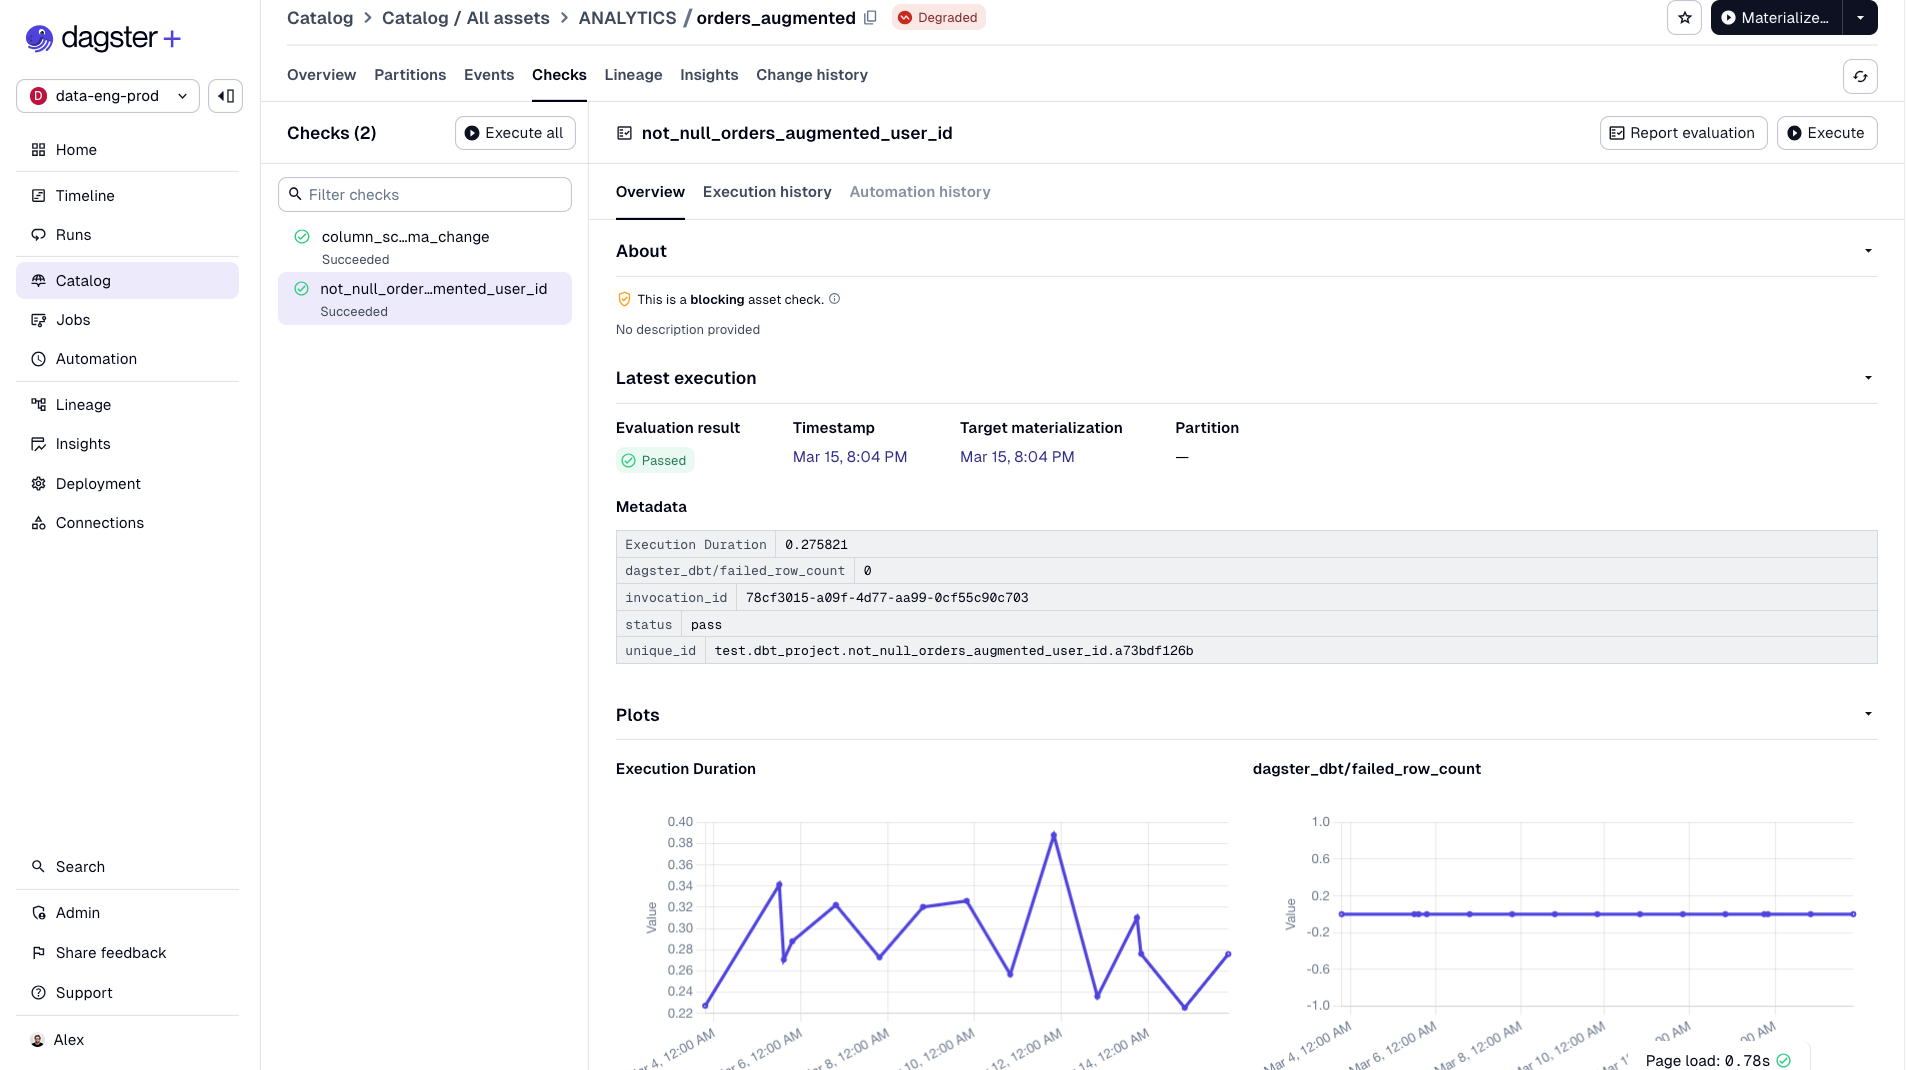
Just a Python function that returns pass or fail. No new DSL, no separate framework. If you use dbt, your dbt tests automatically surface as asset checks with no extra code.
Severity Levels and Blocking
Not all quality issues are equal. Dagster handles this with severity and blocking:
- WARN severity: The check fails but downstream assets still run. Something to investigate, not a showstopper.
- ERROR severity + blocking=True: Downstream assets are blocked from materializing. Bad data stops at the source.
This is critical for trust. Instead of bad data flowing through your pipeline and surfacing in a dashboard days later, you catch it at the source. Stakeholders never see it.
When you have many checks use @multi_asset_check to define multiple checks in a single function:
@dg.multi_asset_check(
    specs=[
        dg.AssetCheckSpec(name="no_null_ids", asset="orders"),
        dg.AssetCheckSpec(name="no_null_items", asset="orders"),
    ]
)
def orders_checks() -> Iterable[dg.AssetCheckResult]:
    orders_df = pd.read_csv("orders.csv")
    yield dg.AssetCheckResult(
        check_name="no_null_ids",
        passed=bool(orders_df["order_id"].isna().sum() == 0),
        asset_key="orders",
    )
    yield dg.AssetCheckResult(
        check_name="no_null_items",
        passed=bool(orders_df["item_id"].isna().sum() == 0),
        asset_key="orders",
    )
You can also use factory patterns to generate checks from configuration and attach metadata to track values over time to catch gradual data drift. See asset checks for the full API.
Visibility
Your pipelines are reliable, and your data quality is enforced. But if your team can't see any of this, it doesn't matter much. Visibility is what turns infrastructure into confidence — it's the difference between stakeholders trusting your data platform and Slacking you every morning to ask if the dashboard is fresh.
Saved Selections
When you've got hundreds of assets across multiple teams and code locations, trying to comprehend everything at once is overwhelming. Saved selections in Dagster+ let you filter your asset graph, save the view, and share it with your team.
key:"RAW_DATA/orders"+ and not group:MARKETING
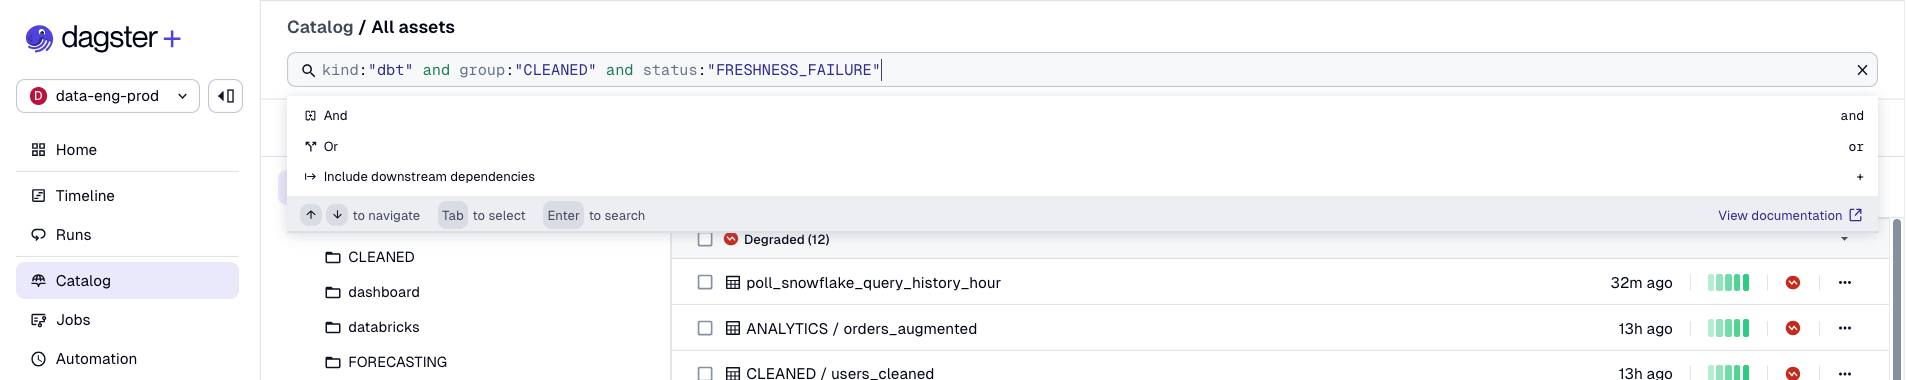
Save a selection with a name and icon, make it public or private, and you get: a filtered asset list, a scoped lineage graph, real-time insights scoped to that selection, and configurable alert policies. You can set alerts to fire when any asset in the selection degrades, changes schema, or violates a freshness policy, and route them to Slack, email, or PagerDuty. The Insights metrics we'll cover next are also scoped to your selections, so if you're a pipeline owner, you see success rates and MTTR for your pipeline, not the entire platform.
Pin selections to your home page and every morning you see at a glance whether your core KPIs are healthy, degraded, or in a warning state. No digging through a global asset graph. No asking around on Slack.
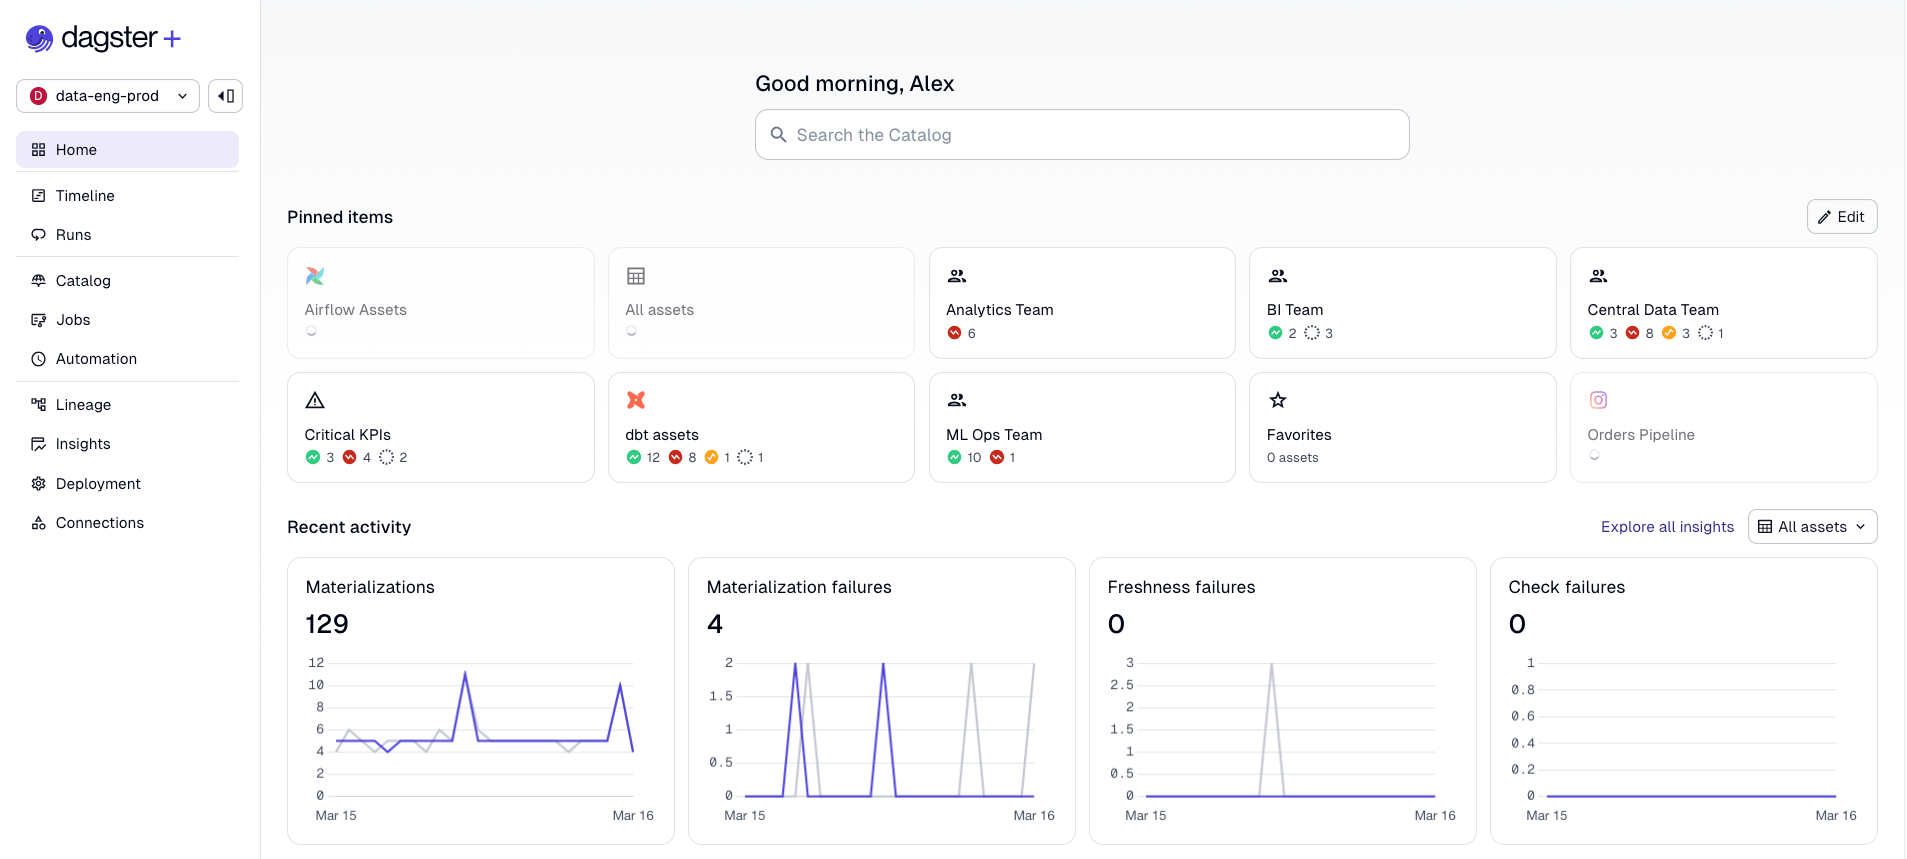
So now you have tailored views for everyone who depends on data. Your analytics engineer sees their dbt models, your ML engineer sees their feature pipelines, your VP sees the KPIs.
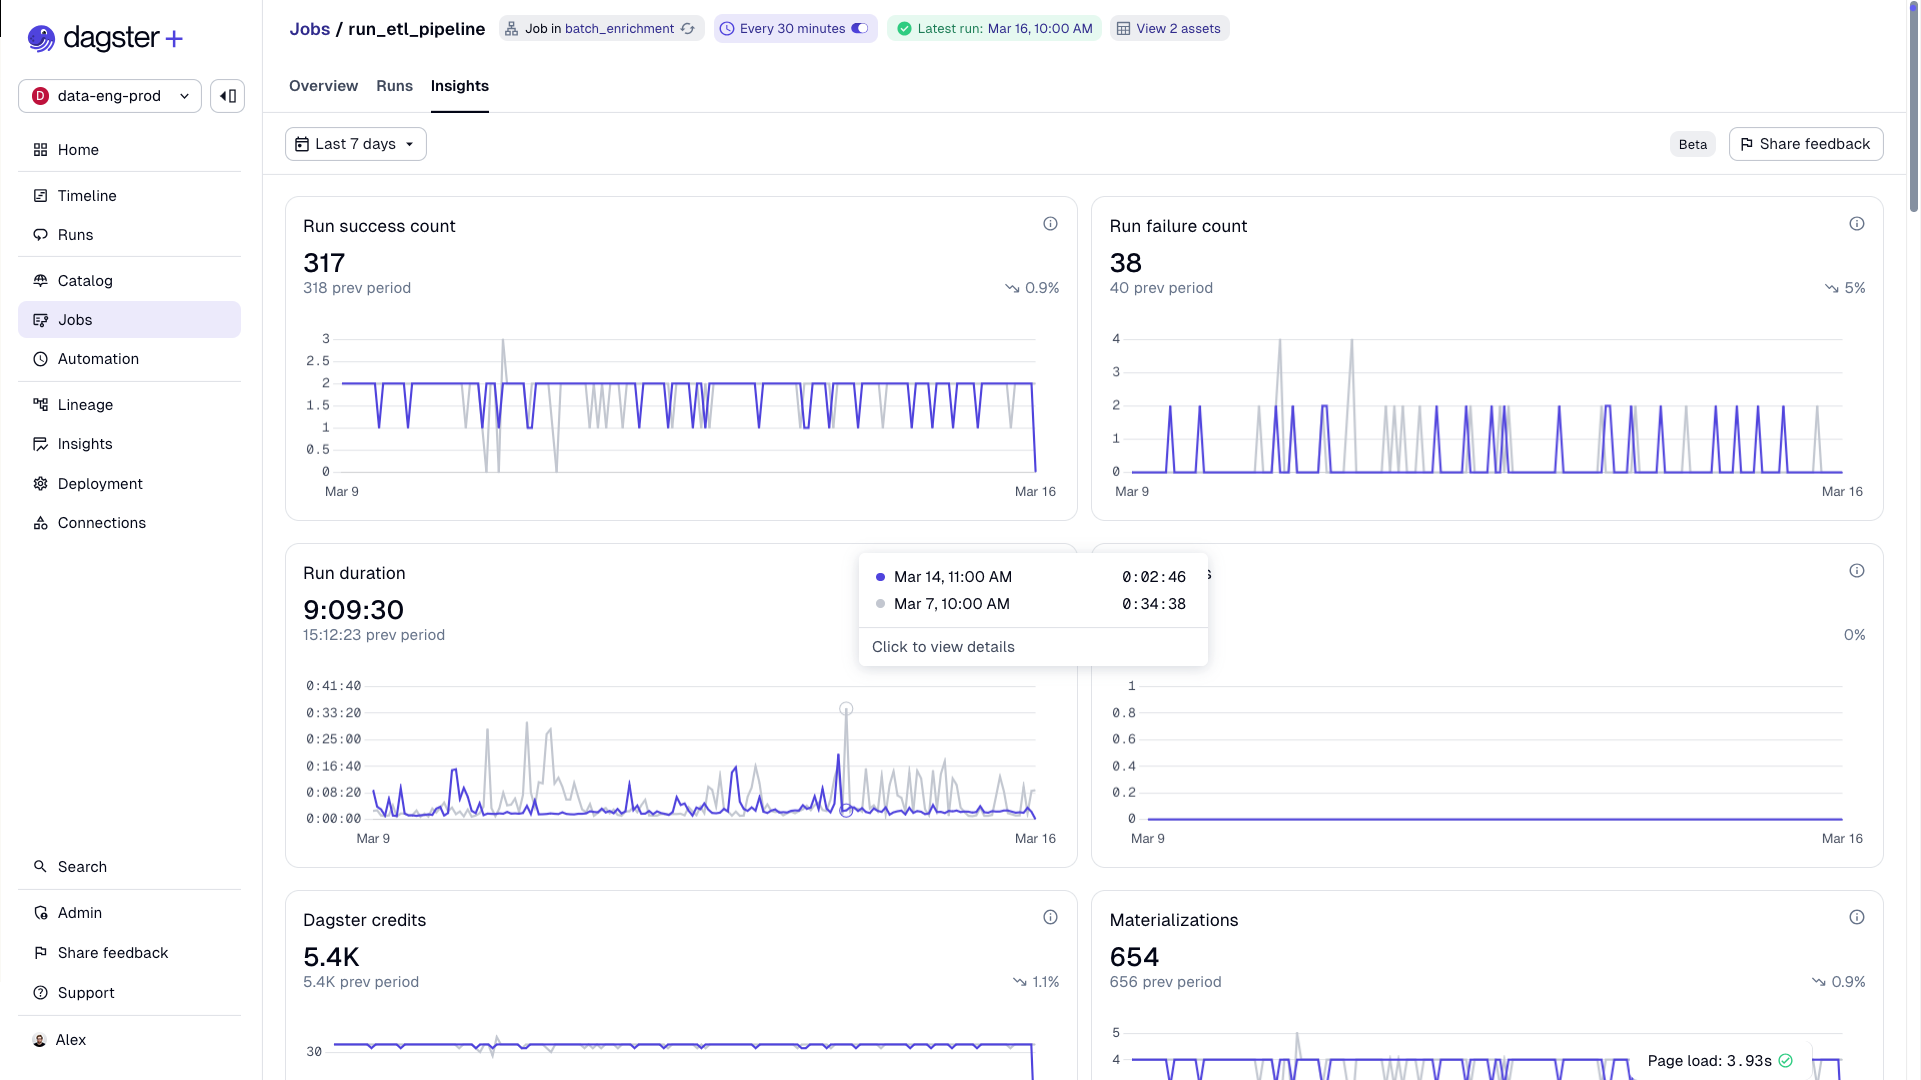
Insights: The Metrics App Developers Have Had for Years
Application developers have had dashboards for uptime, latency, error rates, and MTTR for decades. Data teams? We've been flying blind, judging platform health by whether anyone complained on Slack.
Dagster+ Insights surfaces real-time operational metrics for your data platform:
- Success rate: Percentage of materializations succeeding, with week-over-week trending.
- Freshness pass rate: Are assets meeting their freshness policies? The data equivalent of an uptime SLA.
- Time to resolution: Your MTTR — how long it takes to recover from failures. The metric that proves your reliability investments are working.
- Cost metrics: Snowflake and BigQuery spend attributed to specific assets and jobs.
Insights also includes comparison tools that let you benchmark up to five saved selections side by side, useful for identifying which teams or pipelines need the most investment. Custom metrics let you surface any numeric metadata you emit on materializations (row counts, file sizes, processing durations) for historical aggregation, so you're not limited to built-in KPIs. And for teams with existing observability stacks, Insights data can be exported via GraphQL to Datadog, Grafana, or wherever your organization already tracks operational health. You can also integrate Snowflake and BigQuery cost data directly into Insights for cost attribution at the asset level.
For more, see the Insights guide.
Putting It All Together
DataOps is a practice. Start with the highest-impact change for your team:
- Flaky pipelines? Retries and concurrency controls.
- Bad data reaching stakeholders? Blocking asset checks on critical assets.
- Backfills disrupting production? Run priority and tag concurrency limits.
- Team lacks visibility? Saved selections for pipeline owners.
- Need to prove platform health? Insights for success rate, freshness, and MTTR.
Stakeholder trust is the most important currency a data team has, and it's asymmetric: it takes months to build and minutes to destroy. Every feature in this post either prevents trust from eroding (retries, checks, timeouts) or makes the current state of trust measurable (Insights, saved selections, alerts).
Dagster gives you the building blocks to adopt DataOps incrementally. The goal is making the reliable path the easy path.


.jpg)
.png)


.png)

