


June 9, 2026
How to Make the Architectural Case for Dagster
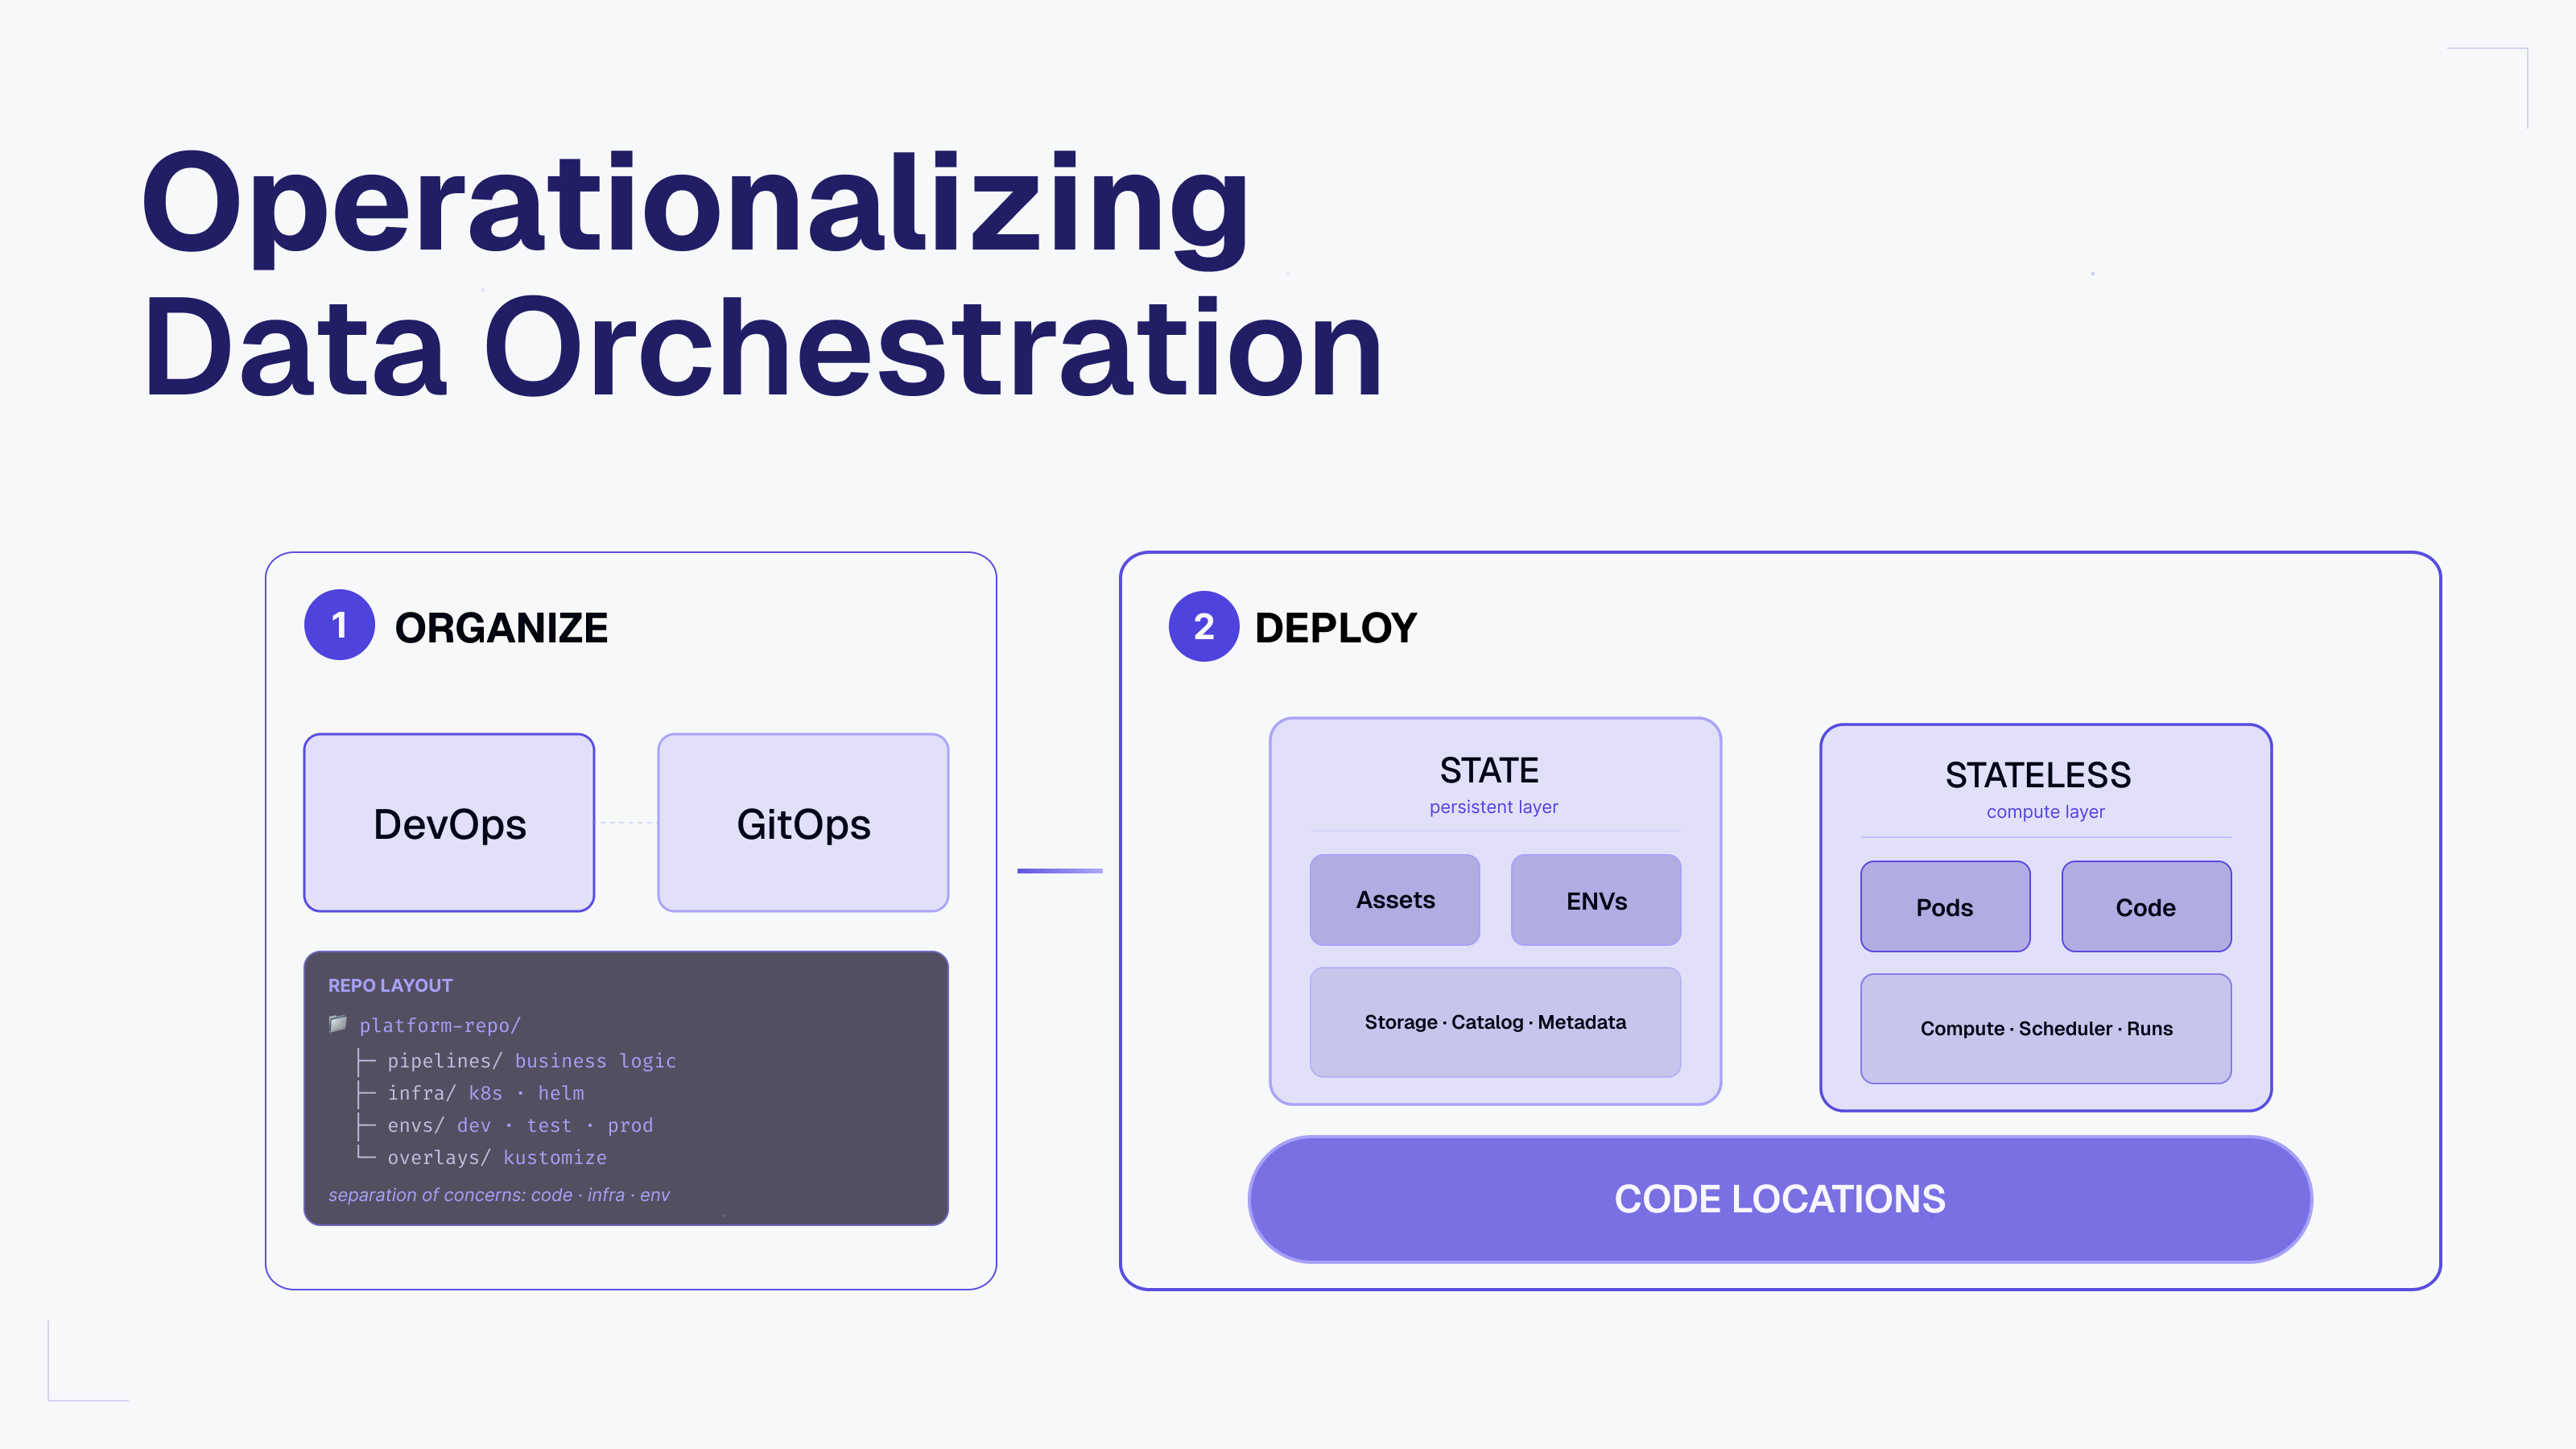
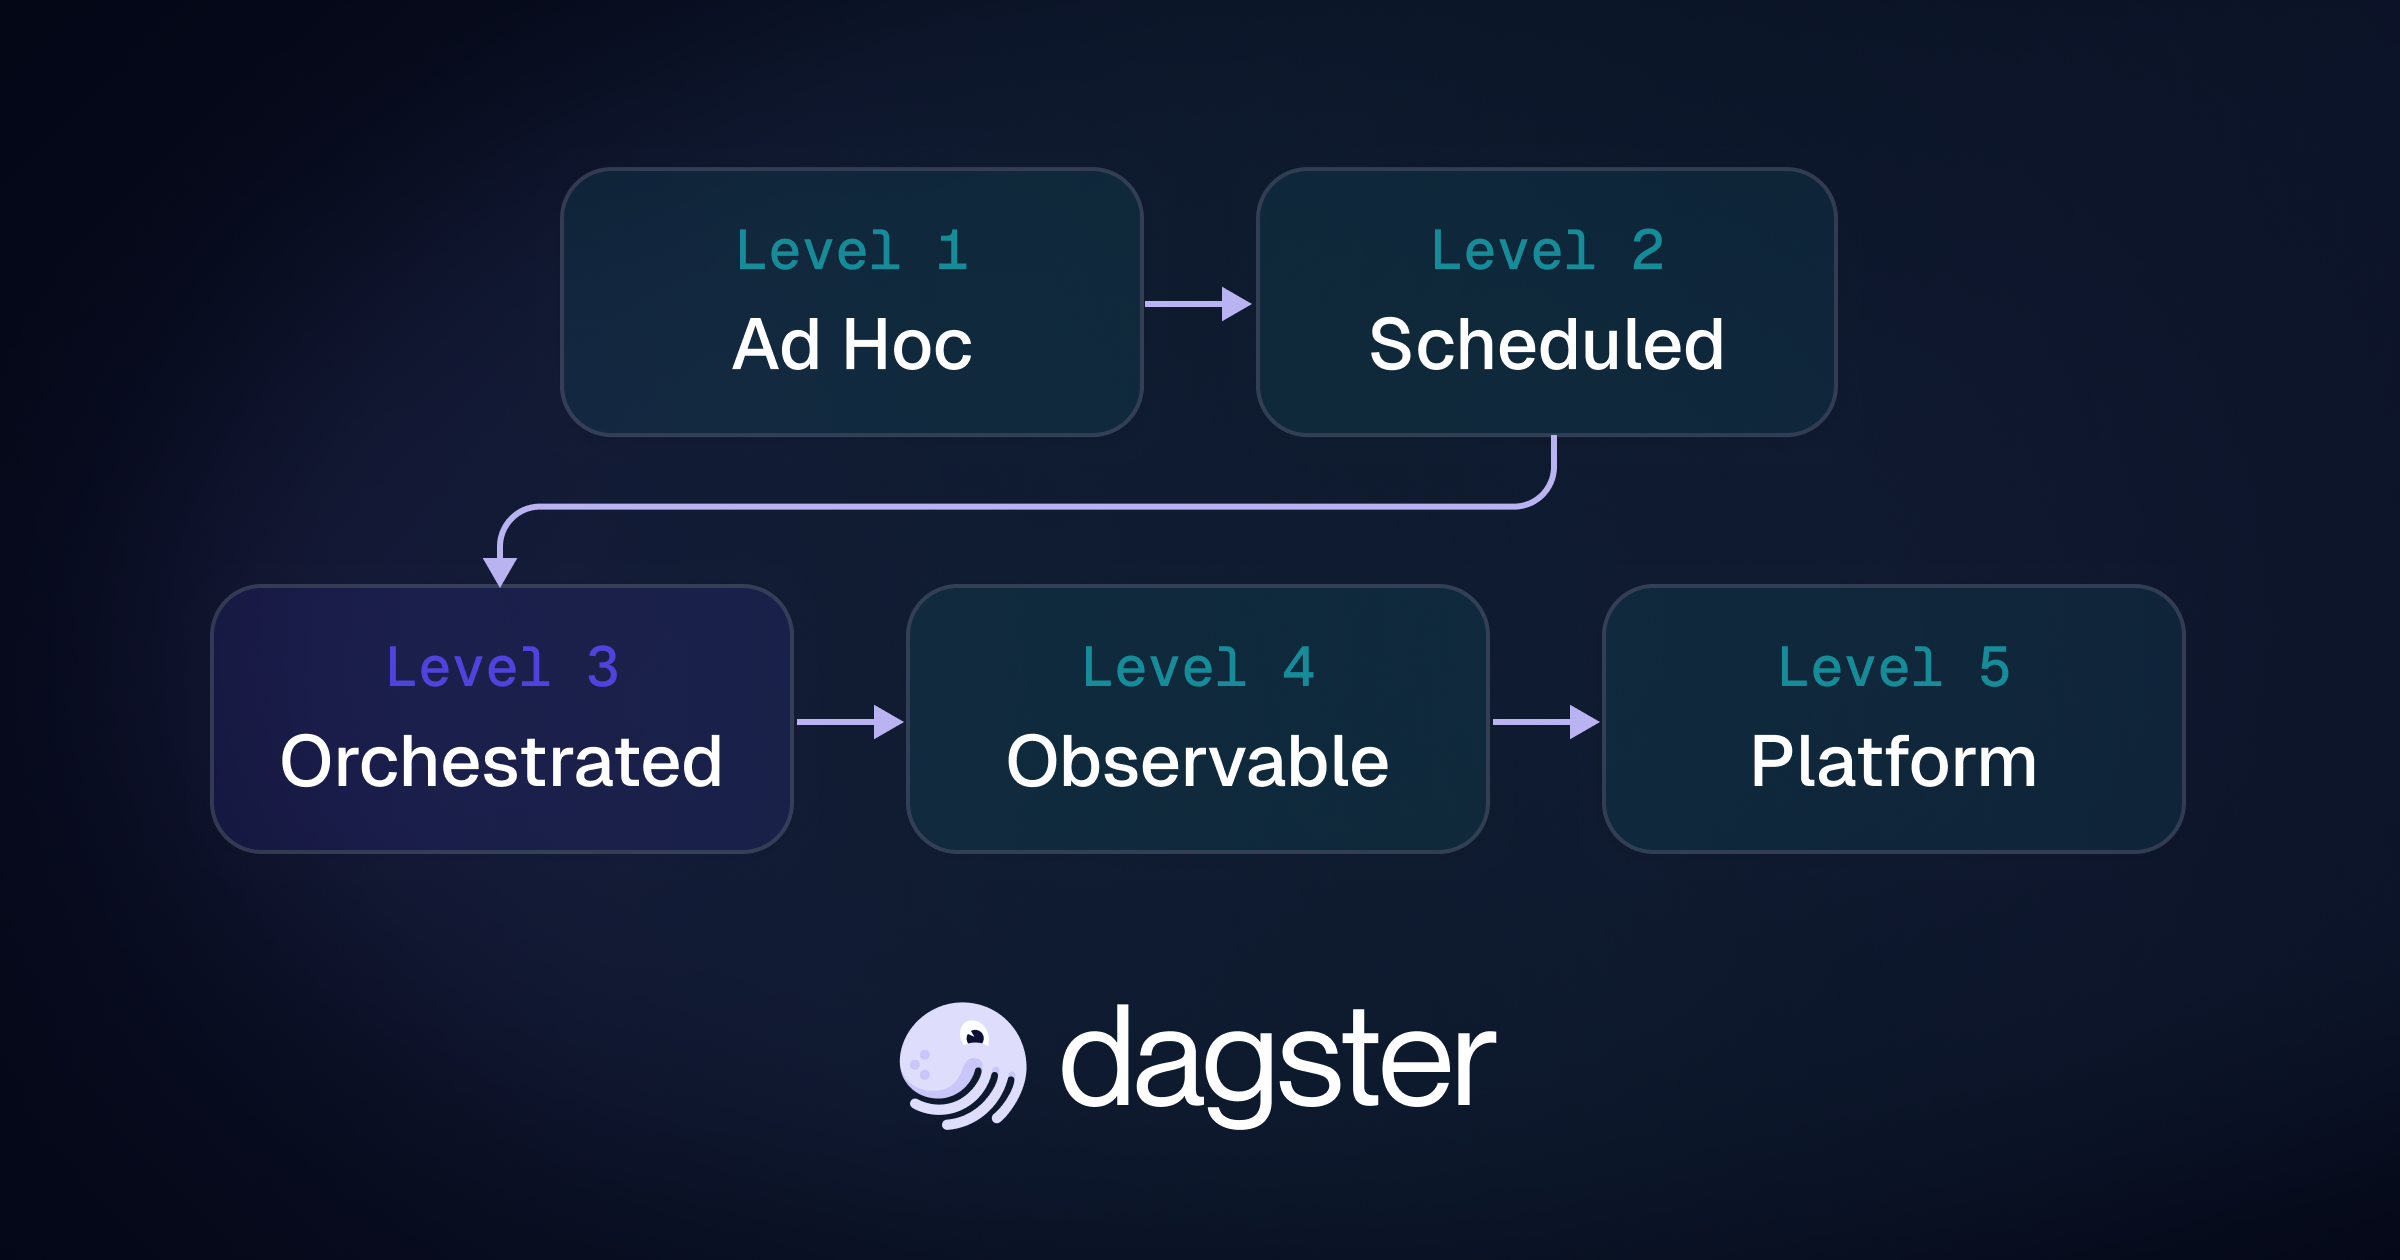
Mature orchestration environments often work operationally while still leaving critical data dependencies implicit. This post introduces the Orchestration Maturity Model, explains the architectural ceiling of job-centric systems, and shows how Dagster’s asset-aware approach helps teams reason about freshness, lineage, quality, and self-service at enterprise scale.


June 1, 2026
How Dagster Compass Powers Brooklyn Data’s Self-Service Analytics
Text-to-analytics promises self-service access to data, but adoption depends on usability, governance, and trust. In this guest post, Brooklyn Data explains how it evaluated Compass, deployed it on top of Snowflake, and enabled teams to answer operational questions directly in Slack while maintaining centralized governance and business context.


May 28, 2026
Snowflake Runs Your Data: Dagster Runs Everything Else
Snowflake increasingly handles transformation and data freshness internally through features like Dynamic Tables and Cortex. Dagster complements Snowflake by providing orchestration, lineage, automation, and cost visibility across your broader data platform from SQL-defined assets to downstream automation and Snowflake query attribution.

May 21, 2026
We Tried ty for Performance. It Found Real Bugs
We adopted Astral’s new Python type checker, ty, to speed up type checking in the Dagster monorepo. The performance gains were dramatic, but the bigger surprise was that ty caught real runtime bugs Pyright missed. Here’s what we learned migrating a large Python codebase incrementally to ty.
April 28, 2026
Announcing the Dagster+ Terraform Provider
The Dagster+ Terraform provider lets platform teams manage deployments, access controls, alerting, and more as code. Define entire environments declaratively, review changes through pull requests, and integrate Dagster+ into your existing infrastructure workflows.


Dagster Newsletter
Get updates delivered to your inbox