Data Linearizing | Dagster Glossary

Back to Glossary Index

Data Linearizing

Transforming the relationship between variables to make datasets approximately linear.

Data linearizing - a definition

Linearizing data is a process where the relationship between variables in a dataset is transformed or adjusted to make it linear or approximately linear. This transformation is often done in data engineering to simplify analysis, improve model performance, or meet assumptions of certain statistical methods.

Methods for linearizing data can vary depending on the nature of the dataset and the specific goals of the analysis. Common techniques include logarithmic transformations, exponential transformations, polynomial transformations, and Box-Cox transformations. Additionally, feature engineering techniques can be employed to create new linear combinations of variables that better capture the underlying relationships in the data.

When to use data linearizing in data engineering

Linearizing data can be useful in data engineering for several reasons:

Data Modeling: Many statistical and ML models assume a linear relationship between variables. By linearizing the data, we can make these models more applicable and effective. And example here is ANOVA (Analysis of Variance): ANOVA tests for significant differences in the means of two or more groups. In its simplest form (one-way ANOVA), it assumes a linear relationship between a categorical independent variable (factor) and a continuous dependent variable.

Normalization: Linearizing data can also involve normalizing it, which makes the data comparable and easier to work with across different scales. Normalization can involve techniques such as scaling variables to have a mean of zero and a standard deviation of one.

Error Reduction: In some cases, linearizing data can help reduce errors or biases in the analysis. For example, when dealing with non-linear relationships, errors might be larger in certain parts of the dataset. Linearizing the data can help mitigate this issue.

Interpretability: Linear relationships are often easier to interpret than non-linear ones. By linearizing the data, we can make the relationships between variables more transparent and understandable.

Assumptions of Analysis Techniques: Certain statistical techniques, such as linear regression, assume that the relationship between variables is linear. Linearizing the data ensures that these assumptions are met, thereby improving the validity of the analysis.

An example of data linearizing in Python

To demonstrate the concept of linearizing data, we will use a common non-linear dataset that follows a power law relationship and then apply a linear transformation to linearize it. This process is often used in data analysis to apply linear regression techniques on datasets that do not initially exhibit a linear relationship.

Consider a dataset that follows the equation y = ax^b, where a and b are constants. This is a common form of a power law relationship. To linearize this data, we can apply a logarithmic transformation to both sides of the equation, resulting in a linear relationship that can be analyzed with linear regression techniques.

The transformed equation becomes log(y) = log(a) + blog(x).

Here is a step-by-step Python example:

  1. Generate a synthetic dataset that follows a power law relationship.
  2. Plot the original dataset to show its non-linear nature.
  3. Apply a logarithmic transformation to both x and y to linearize the data.
  4. Plot the transformed (linearized) dataset.
  5. Perform a linear regression on the transformed data as a demonstration of how linearization allows for linear modeling techniques to be applied to non-linear data.

The dataset includes random noise, simulating data variability. The plots and linear regression analysis demonstrate how the logarithmic transformation still effectively linearizes the data, allowing for linear regression to be applied. The added variability makes the data analysis scenario more representative of real-world data challenges.

Noise is added as a small fraction of the y_power_law value to minimize the risk of y becoming non-positive. This approach should prevent the occurrence of NaN values during the logarithmic transformation and allow the linear regression analysis to proceed without errors.

Please note that you need to have the necessary Python libraries installed in your Python environment to run this code.

import numpy as np
import matplotlib.pyplot as plt
from sklearn.linear_model import LinearRegression

# Step 1: Generate a synthetic non-linear dataset
np.random.seed(0)  # For reproducibility
x = np.random.uniform(1, 10, 100)  # Generate 100 random samples from 1 to 10
a = 2
b = 3
# Ensure y is always positive by adjusting the magnitude of noise
# Calculate the power law component
y_power_law = a * x**b
# Add noise that is a small fraction of the y_power_law value to avoid negative or zero values
noise = np.random.normal(0, y_power_law * 0.1, x.shape)  # Adjust noise level here
y = y_power_law + noise  # y follows a power law relationship with x, with adjusted noise

# Step 2: Plot the original dataset
plt.figure(figsize=(10, 5))
plt.subplot(1, 2, 1)
plt.scatter(x, y, color='blue')
plt.title('Original Non-linear Dataset with Adjusted Variability')
plt.xlabel('x')
plt.ylabel('y')

# Step 3: Linearize the dataset
x_log = np.log(x)
y_log = np.log(y)  # This should now work without resulting in NaN values

# Step 4: Plot the transformed (linearized) dataset
plt.subplot(1, 2, 2)
plt.scatter(x_log, y_log, color='red')
plt.title('Transformed Linearized Dataset')
plt.xlabel('log(x)')
plt.ylabel('log(y)')

# Perform linear regression on the transformed data
model = LinearRegression()
model.fit(x_log.reshape(-1, 1), y_log)  # Reshape x_log for sklearn
slope = model.coef_[0]
intercept = model.intercept_
print(f"Linear regression on transformed data: y = {slope:.2f}x + {intercept:.2f}")

# Plotting the regression line
y_pred = model.predict(x_log.reshape(-1, 1))
plt.plot(x_log, y_pred, color='green', label=f'y = {slope:.2f}x + {intercept:.2f}')
plt.legend()

plt.tight_layout()
plt.show()

Running this code will output a plot along these lines:

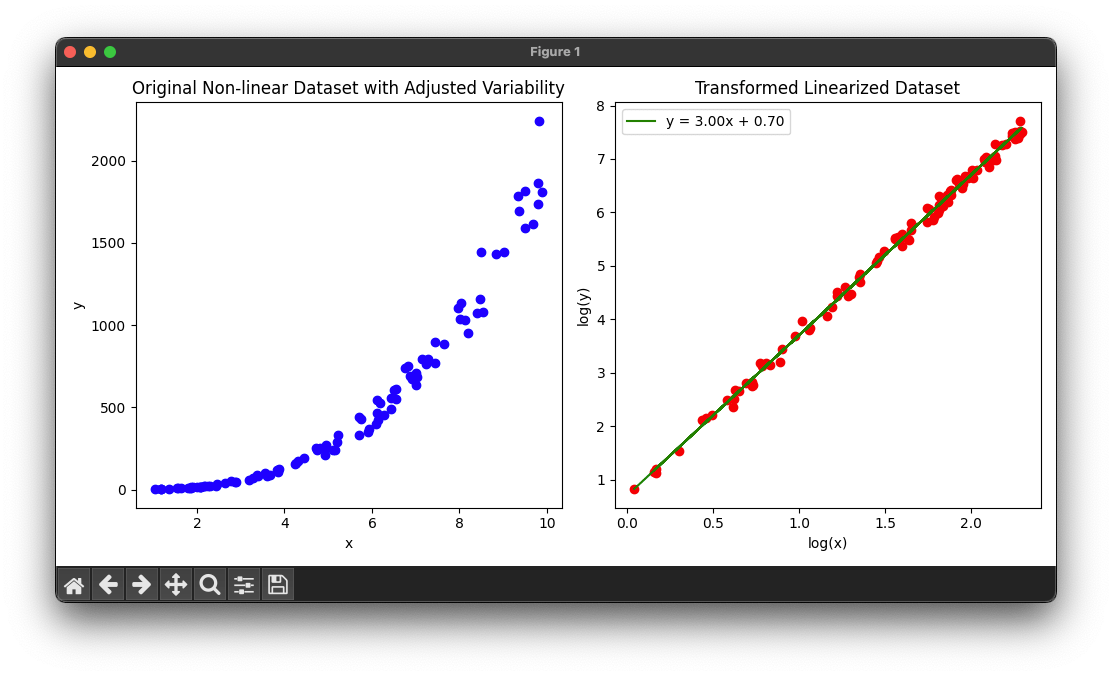
This example demonstrates how to linearize non-linear data to analyze it using linear methods. The first plot (blue) shows the original non-linear relationship, while the second plot (red) shows the data after applying a logarithmic transformation, making it linear. The linear regression model is then fitted to the transformed data, demonstrating the effectiveness of linearization in analyzing non-linear relationships.


Other data engineering terms related to
Data Transformation:
Dagster Glossary code icon

Align

Aligning data can mean one of three things: aligning datasets, meeting business rules, or arranging data elements in memory.
An image representing the data engineering concept of 'Align'
Dagster Glossary code icon

Clean or Cleanse

Remove invalid or inconsistent data values, such as empty fields or outliers.
An image representing the data engineering concept of 'Clean or Cleanse'
Dagster Glossary code icon

Cluster

Group data points based on similarities or patterns to facilitate analysis and modeling.
An image representing the data engineering concept of 'Cluster'
Dagster Glossary code icon

Curate

Select, organize, and annotate data to make it more useful for analysis and modeling.
An image representing the data engineering concept of 'Curate'
Dagster Glossary code icon

Denoise

Remove noise or artifacts from data to improve its accuracy and quality.
An image representing the data engineering concept of 'Denoise'
Dagster Glossary code icon

Denormalize

Optimize data for faster read access by reducing the number of joins needed to retrieve related data.
An image representing the data engineering concept of 'Denormalize'
Dagster Glossary code icon

Derive

Extracting, transforming, and generating new data from existing datasets.
An image representing the data engineering concept of 'Derive'
Dagster Glossary code icon

Discretize

Transform continuous data into discrete categories or bins to simplify analysis.
An image representing the data engineering concept of 'Discretize'
Dagster Glossary code icon

ETL

Extract, transform, and load data between different systems.
An image representing the data engineering concept of 'ETL'
Dagster Glossary code icon

Encode

Convert categorical variables into numerical representations for ML algorithms.
An image representing the data engineering concept of 'Encode'
Dagster Glossary code icon

Filter

Extract a subset of data based on specific criteria or conditions.
An image representing the data engineering concept of 'Filter'
Dagster Glossary code icon

Fragment

Break data down into smaller chunks for storage and management purposes.
An image representing the data engineering concept of 'Fragment'
Dagster Glossary code icon

Homogenize

Make data uniform, consistent, and comparable.
An image representing the data engineering concept of 'Homogenize'
Dagster Glossary code icon

Impute

Fill in missing data values with estimated or imputed values to facilitate analysis.
An image representing the data engineering concept of 'Impute'

Munge

See 'wrangle'.
An image representing the data engineering concept of 'Munge'
Dagster Glossary code icon

Normalize

Standardize data values to facilitate comparison and analysis. Organize data into a consistent format.
Dagster Glossary code icon

Reduce

Convert a large set of data into a smaller, more manageable form without significant loss of information.
An image representing the data engineering concept of 'Reduce'
Dagster Glossary code icon

Reshape

Change the structure of data to better fit specific analysis or modeling requirements.
An image representing the data engineering concept of 'Reshape'
Dagster Glossary code icon

Serialize

Convert data into a linear format for efficient storage and processing.
An image representing the data engineering concept of 'Serialize'
Dagster Glossary code icon

Shred

Break down large datasets into smaller, more manageable pieces for easier processing and analysis.
Dagster Glossary code icon

Skew

An imbalance in the distribution or representation of data.
Dagster Glossary code icon

Split

Divide a dataset into training, validation, and testing sets for machine learning model training.
Dagster Glossary code icon

Standardize

Transform data to a common unit or format to facilitate comparison and analysis.
Dagster Glossary code icon

Tokenize

Convert data into tokens or smaller units to simplify analysis or processing.
An image representing the data engineering concept of 'Tokenize'

Transform

Convert data from one format or structure to another.
Dagster Glossary code icon

Wrangle

Convert unstructured data into a structured format.
An image representing the data engineering concept of 'Wrangle'