


Data clustering definition:
Data clustering is a technique that groups similar data points into clusters based on their similarities. This can be useful in various data engineering applications such as customer segmentation, anomaly detection, and image segmentation.
data clustering example in Python:
In Python, there are several libraries that can be used for data clustering, including scikit-learn, KMeans, and DBSCAN.
Here are some practical examples of using these libraries for data clustering:
K-Means clustering:
K-Means is a popular algorithm used for clustering data. We can apply K-Means clustering against a synthetic dataset with 300 samples, 4 clusters, and a specified random state for reproducibility as follows:
Please note that you need to have the necessary Python libraries installed in your Python environment to run this code.
import numpy as np
import matplotlib.pyplot as plt
from sklearn.cluster import KMeans
from sklearn.datasets import make_blobs

# Create synthetic dataset
n_samples = 300
random_state = 42
X, y = make_blobs(n_samples=n_samples, centers=4, random_state=random_state, cluster_std=1.2)

# Perform K-Means clustering
k = 4  # Number of clusters
kmeans = KMeans(n_clusters=k, random_state=random_state, n_init=1)
kmeans.fit(X)

# Visualize the results
plt.scatter(X[:, 0], X[:, 1], c=kmeans.labels_, cmap='viridis')
plt.scatter(kmeans.cluster_centers_[:, 0], kmeans.cluster_centers_[:, 1], s=200, c='red', marker='x', label='Cluster Centers')
plt.xlabel('Feature 1')
plt.ylabel('Feature 2')
plt.title('K-Means Clustering with k = {}'.format(k))
plt.legend()
plt.show()
which will vizualize the clustering as follows:
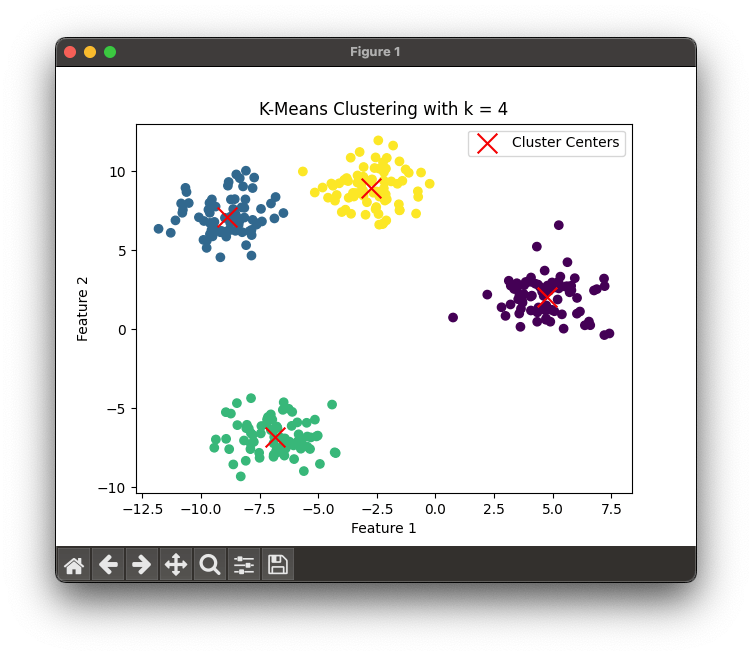
This is a fairly simple example of K-Means clustering. Scroll down for a more sophisticated example.
Hierarchical clustering:
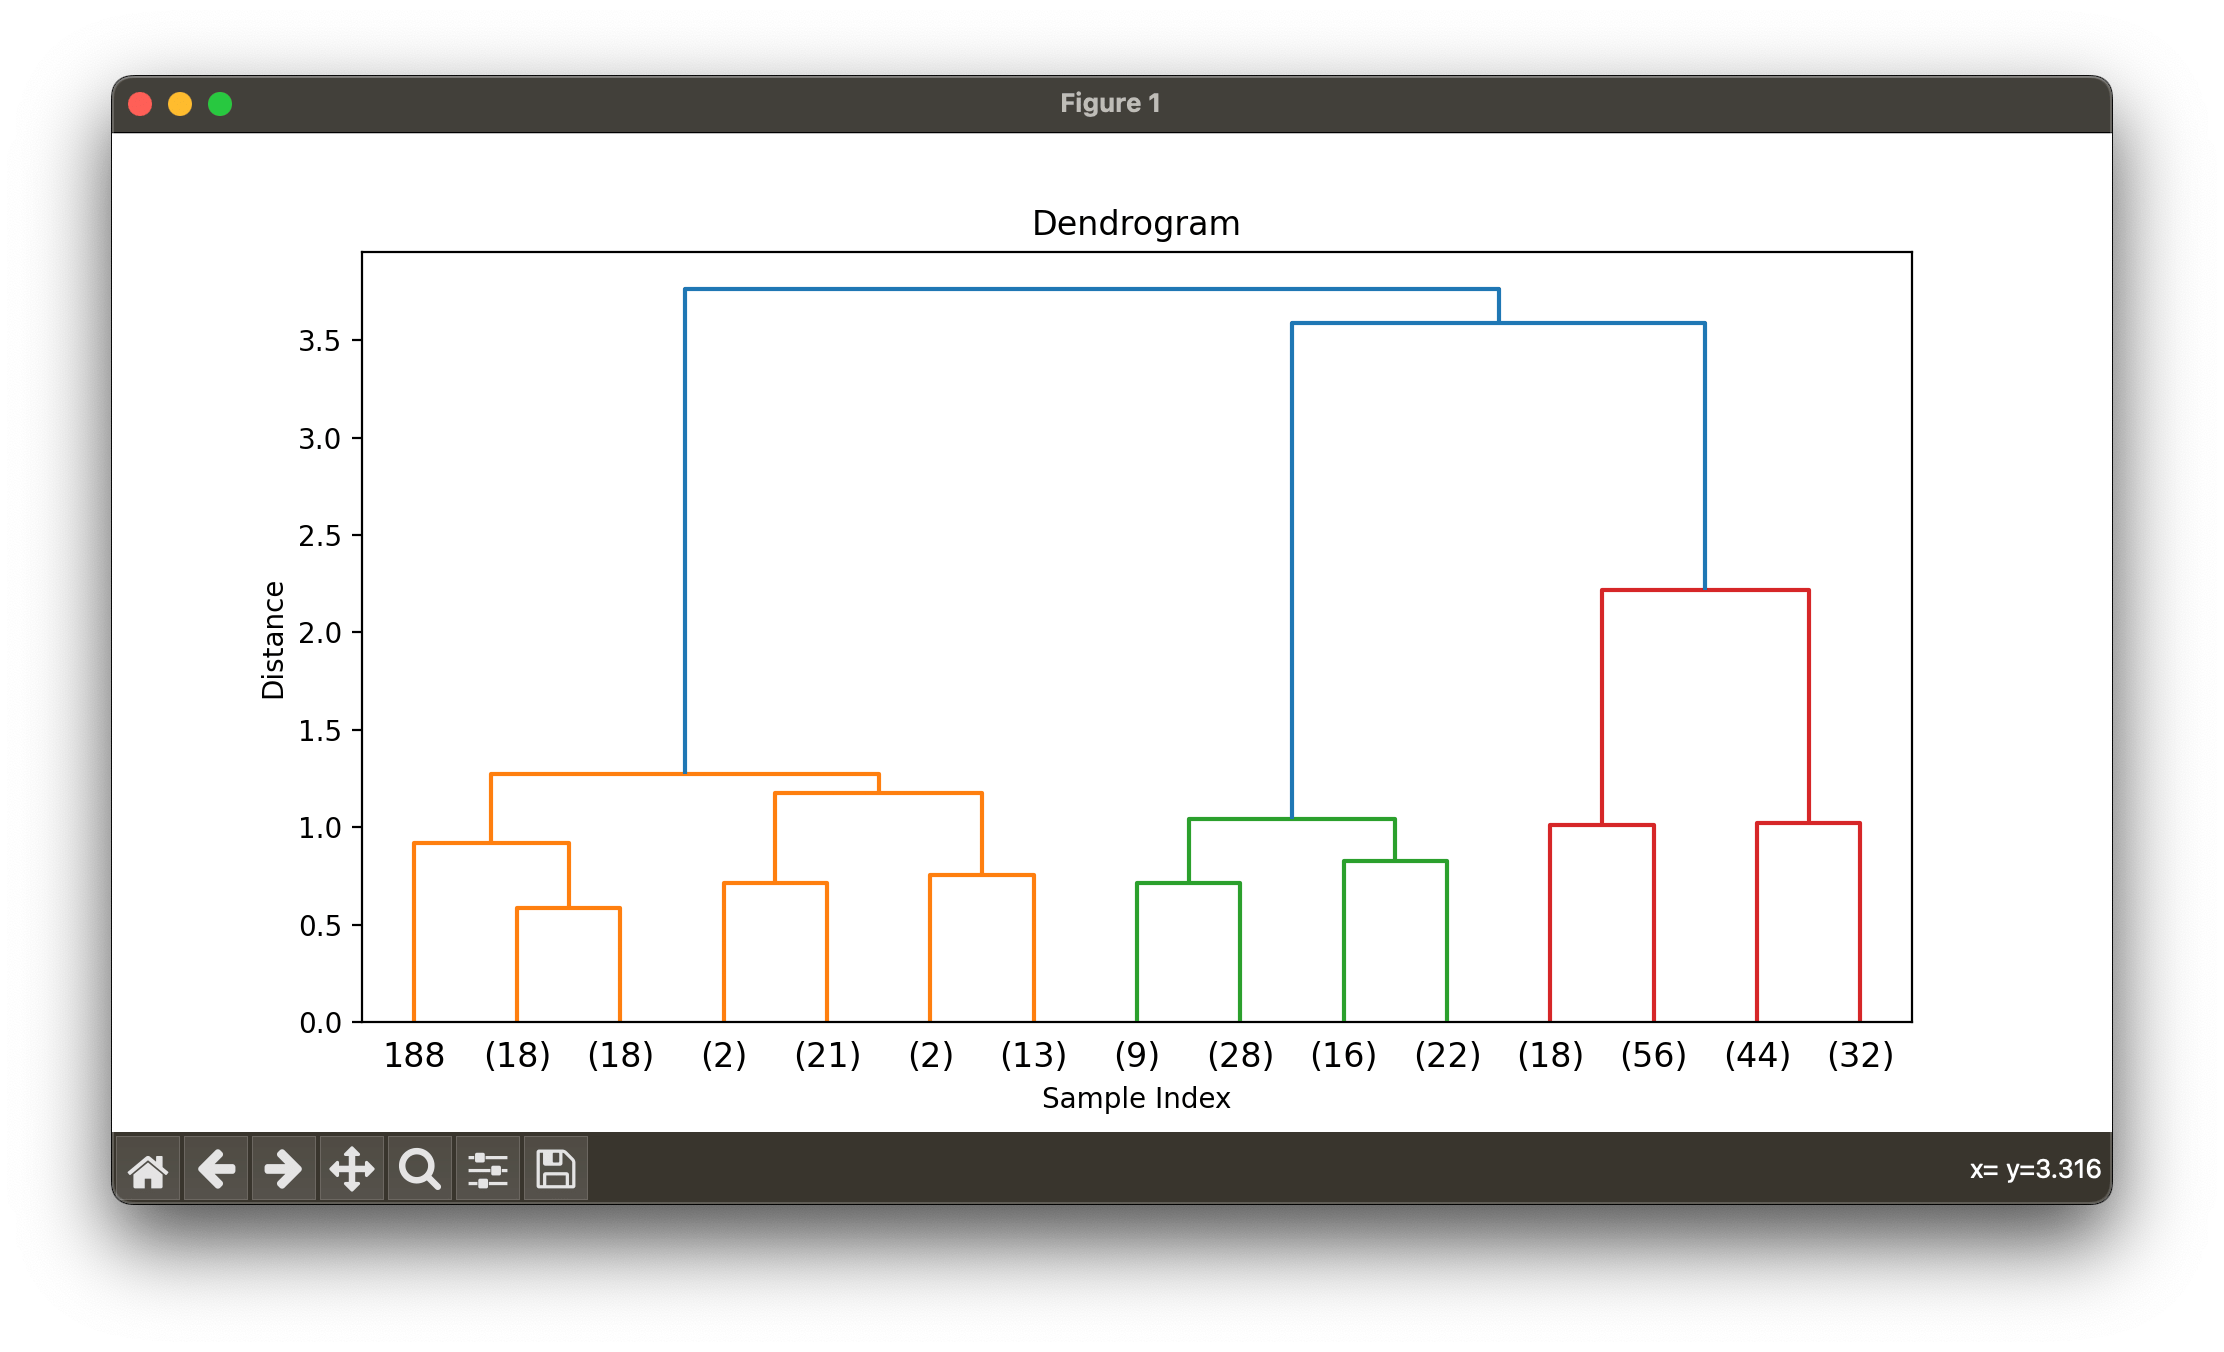
Hierarchical clustering is a technique that creates a tree-like structure of clusters.
Here is one example of Hierarchical clustering using a synthetic dataset. You can modify the dataset, linkage method, or clustering parameters to experiment with different datasets and see how Hierarchical clustering works on various data.
import numpy as np
import matplotlib.pyplot as plt
from sklearn.datasets import make_blobs
from sklearn.preprocessing import StandardScaler
from scipy.cluster.hierarchy import dendrogram, linkage
from sklearn.cluster import AgglomerativeClustering

# Create synthetic dataset
n_samples = 300
random_state = 42
X, y = make_blobs(n_samples=n_samples, centers=4, random_state=random_state, cluster_std=1.2)

# Standardize the dataset
scaler = StandardScaler()
X_scaled = scaler.fit_transform(X)

# Perform hierarchical clustering using complete linkage
linkage_matrix = linkage(X_scaled, method='complete')

# Plot dendrogram
plt.figure(figsize=(10, 5))
dendrogram(linkage_matrix, truncate_mode='level', p=3)
plt.title('Dendrogram')
plt.xlabel('Sample Index')
plt.ylabel('Distance')
plt.show()

# Choose the number of clusters based on the dendrogram
n_clusters = 4

# Perform Agglomerative Clustering with the chosen number of clusters
agg_clustering = AgglomerativeClustering(n_clusters=n_clusters)
agg_clustering.fit(X_scaled)

# Visualize the results
plt.scatter(X_scaled[:, 0], X_scaled[:, 1], c=agg_clustering.labels_, cmap='viridis', alpha=0.7)
plt.xlabel('Feature 1 (Standardized)')
plt.ylabel('Feature 2 (Standardized)')
plt.title('Hierarchical Clustering with {} Clusters'.format(n_clusters))
plt.show()
This script performs the following steps:
- Import necessary libraries: NumPy, Matplotlib, scikit-learn, and SciPy.
- Create a synthetic dataset with 300 samples, 4 clusters, and a specified random state for reproducibility.
- Standardize the dataset using StandardScaler.
- Perform hierarchical clustering using complete linkage method.
- Plot the dendrogram to visualize the hierarchical clustering structure.
- Choose the number of clusters based on the dendrogram.
- Perform Agglomerative Clustering with the chosen number of clusters.
- Visualize the results, including the cluster assignments:
Both k-means and hierarchical clustering are good techniques to explore if you are new to data clustering.
DBSCAN clustering
DBSCAN is another popular clustering algorithm that can be useful for detecting outliers in data. Here's an example of using DBSCAN to cluster customer data based on their spending habits:
from sklearn.cluster import DBSCAN
import pandas as pd

# load customer spending data
data = pd.read_csv('input.csv')

# extract relevant features
features = ['col_A', 'col_B', 'col_C', 'col_D']
X = data[features]

# perform DBSCAN clustering with eps=3 and min_samples=2
dbscan = DBSCAN(eps=3, min_samples=2).fit(X)

# add cluster labels to the original data
data['cluster'] = dbscan.labels_

# save results to a new CSV file
data.to_csv('output.csv', index=False)
These are just a few examples of how data clustering can be used in data pipelines using Python. Other techniques include
- Hierarchical Clustering
- Density-Based Spatial Clustering of Applications with Noise (DBSCAN)
- Expectation-Maximization (EM) Clustering
- Fuzzy C-Means Clustering
- Affinity Propagation Clustering
- Spectral Clustering
- Subspace Clustering
- Grid-Based Clustering
… and many more Model-Based Clustering techniques
The choice of algorithm and parameters will depend on the specific problem being solved and the characteristics of the data.
A more sophisticated example of K-Means clustering in Python:
Here's a more elaborate example of K-Means clustering in Python using the popular machine learning library, scikit-learn. In this example, we'll apply K-Means clustering to the Iris dataset and evaluate the quality of the clustering using various metrics.
import numpy as np
import pandas as pd
import matplotlib.pyplot as plt
from sklearn.cluster import KMeans
from sklearn.datasets import load_iris
from sklearn.metrics import silhouette_score, adjusted_rand_score
from sklearn.preprocessing import StandardScaler

# Load the Iris dataset
iris = load_iris()
X = iris.data
y = iris.target

# Standardize the dataset
scaler = StandardScaler()
X_scaled = scaler.fit_transform(X)

# Determine the optimal number of clusters using the elbow method and silhouette scores
inertia = []
silhouette_scores = []
k_values = list(range(2, 11))

for k in k_values:
    kmeans = KMeans(n_clusters=k, random_state=42, n_init=10)
    kmeans.fit(X_scaled)
    inertia.append(kmeans.inertia_)
    silhouette_scores.append(silhouette_score(X_scaled, kmeans.labels_))

# Plot the elbow method and silhouette scores
fig, (ax1, ax2) = plt.subplots(1, 2, figsize=(12, 4))

ax1.plot(k_values, inertia, 'o-')
ax1.set_title('Elbow Method')
ax1.set_xlabel('Number of Clusters (k)')
ax1.set_ylabel('Inertia')

ax2.plot(k_values, silhouette_scores, 'o-')
ax2.set_title('Silhouette Scores')
ax2.set_xlabel('Number of Clusters (k)')
ax2.set_ylabel('Silhouette Score')

plt.show()

# Choose the optimal number of clusters based on the elbow method and silhouette scores
optimal_k = 3

# Perform K-Means clustering with the optimal number of clusters
kmeans = KMeans(n_clusters=optimal_k, random_state=42, n_init=10)
kmeans.fit(X_scaled)

# Visualize the results
plt.scatter(X_scaled[:, 0], X_scaled[:, 1], c=kmeans.labels_, cmap='viridis', alpha=0.7)
plt.scatter(kmeans.cluster_centers_[:, 0], kmeans.cluster_centers_[:, 1], s=200, c='red', marker='x', label='Cluster Centers')
plt.xlabel('Sepal Length (Standardized)')
plt.ylabel('Sepal Width (Standardized)')
plt.title('K-Means Clustering with k = {}'.format(optimal_k))
plt.legend()
plt.show()

# Evaluate the clustering
silhouette = silhouette_score(X_scaled, kmeans.labels_)
ari = adjusted_rand_score(y, kmeans.labels_)
print("Silhouette Score: {:.3f}".format(silhouette))
print("Adjusted Rand Index: {:.3f}".format(ari))
This script performs the following steps:
- Import necessary libraries: NumPy, pandas, Matplotlib, and scikit-learn.
- Load the Iris dataset and extract features and target labels.
- Standardize the dataset using
StandardScaler. - Determine the optimal number of clusters (k) using the elbow method and silhouette scores.
- Plot the elbow method and silhouette scores to visualize the optimal number of clusters.
- Perform K-Means clustering with the optimal number of clusters.
- Visualize the results, including the cluster assignments and cluster centers.
- Evaluate the quality of the clustering using silhouette scores and adjusted Rand index.
In this example, we use the elbow method and silhouette scores to determine the optimal number of clusters for K-Means clustering. We then perform the clustering with the optimal number of clusters and visualize the results. Finally, we evaluate the quality of the clustering using silhouette scores and adjusted Rand index.
In this example, we use the elbow method and silhouette scores to determine the optimal number of clusters for K-Means clustering. We then perform the clustering with the optimal number of clusters and visualize the results. Finally, we evaluate the quality of the clustering using silhouette scores and adjusted Rand index.
By running the script, you can observe the elbow method and silhouette scores plots that help determine the optimal number of clusters.

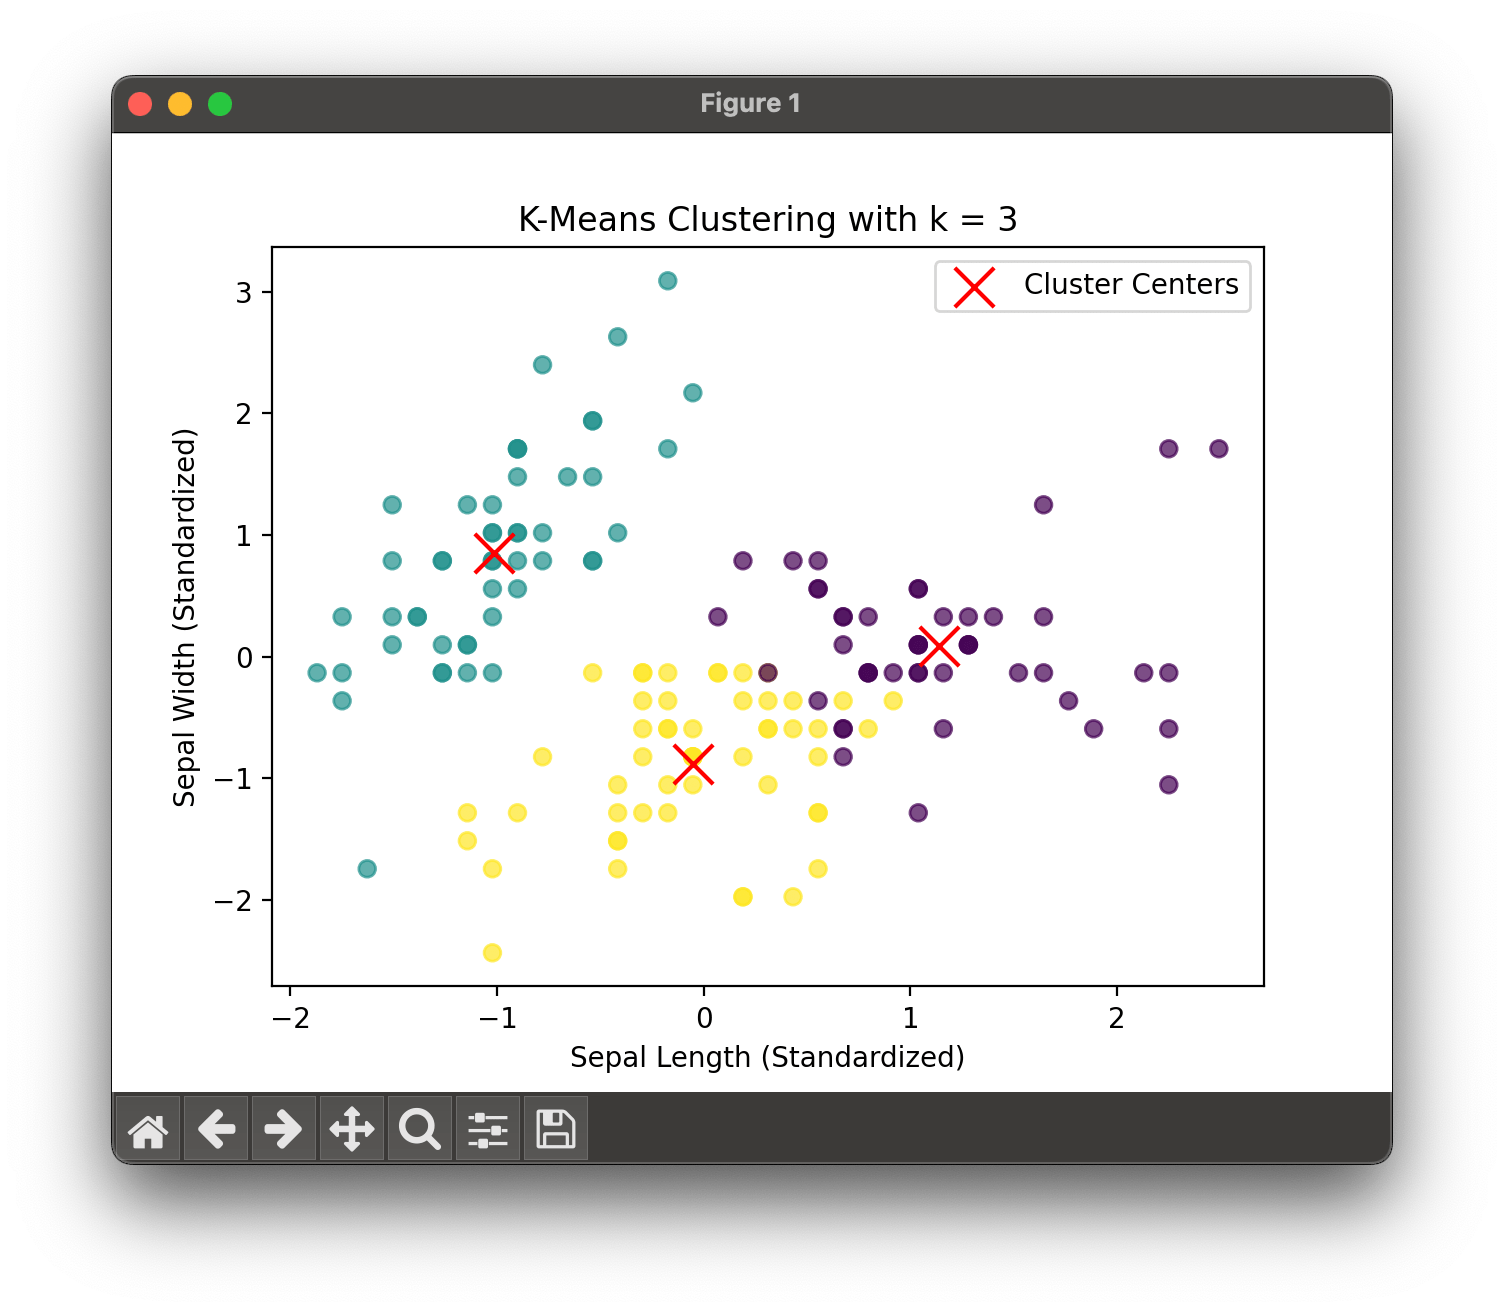
In this case, k=3 seems to be a good choice. The visualization of the clustering result shows the different clusters and their centers.
The Silhouette Score and Adjusted Rand Index are used to measure the quality of the clustering.
Silhouette Score: 0.460
Adjusted Rand Index: 0.620
A higher Silhouette Score indicates better separation between clusters, while the Adjusted Rand Index measures the similarity between the true labels and the predicted cluster assignments. In this case, the Silhouette Score and Adjusted Rand Index provide an indication of the quality of the clustering result.
You can modify the dataset or clustering parameters to experiment with different datasets and see how K-Means clustering works on various data.
