Unlike most of the entries in our glossary, skew is not something engineers do to data, but a characteristic of the data itself.
Note: There is a second use of the term _skew_ in data engineering, namely "Imbalanced load across partitions, such that some partitions have lots of requests or data, and others have much less. Also known as _hot spots_." See "Skewed Workloads and Relieving Hot Spots" in the O'Reilly book _Designing Data-Intensive Applications_ by Martin Kleppmann
Data skew definition:
Data skew, also known as skewness, refers to an imbalance in the distribution or representation of data. In the context of distributed computing, this imbalance often leads to inefficient processing because some nodes in the system end up processing significantly more data than others.
This can occur in several ways. For example, one common type of skew is key-value skew, where some keys in your data map to significantly more values than others. If your processing tasks involve these keys, they can take much longer to process than tasks involving other keys. This imbalance can lead to an overall slowdown in your pipeline because other nodes may be sitting idle while a few nodes are still processing.
Another type of skew is time skew, where certain time periods have significantly more data than others. This can also lead to imbalances and inefficiencies in your pipeline if not accounted for.
Strategies for dealing with data skew can involve redistributing the data, adjusting the granularity of tasks, using more robust statistics or models that can handle skew, or pre-processing the data to balance out the skew.
Illustrating skewness using Python
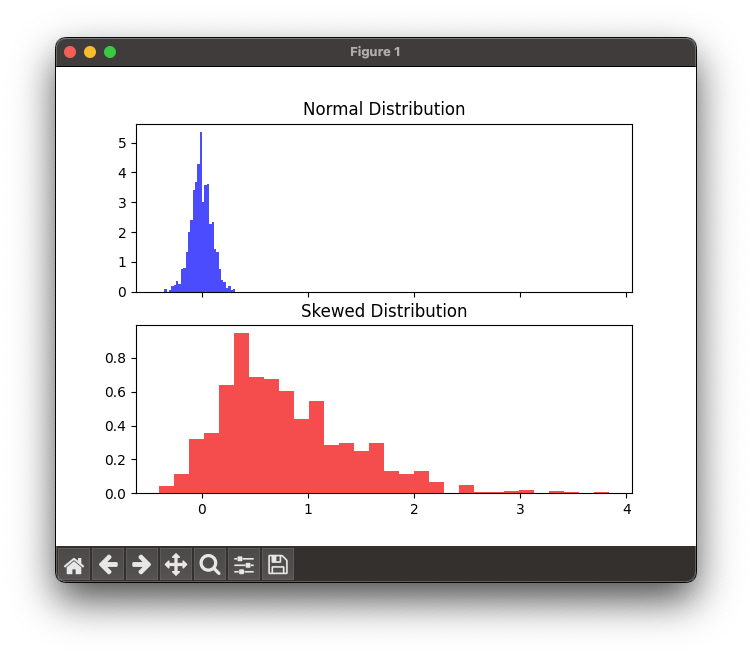
We can illustrate the concept of data skewness using two distributions, one normal (symmetrical) and another skewed.
Please note that you need to have the necessary Python libraries installed in your Python environment to run this code.
Here's how you can do it using matplotlib and scipy.stats:
import matplotlib.pyplot as plt
import numpy as np
import scipy.stats as stats

# Create a normal distribution
mu, sigma = 0, 0.1 # mean and standard deviation
normal_dist = np.random.normal(mu, sigma, 1000)

# Create a skewed distribution
skewness = 5  # positive value means right skew
skewed_dist = stats.skewnorm.rvs(a = skewness, size=1000)

# Create subplots
fig, axs = plt.subplots(2, sharex=True)

# Plot normal distribution
axs[0].hist(normal_dist, bins=30, density=True, color='b', alpha=0.7)
axs[0].set_title('Normal Distribution')

# Plot skewed distribution
axs[1].hist(skewed_dist, bins=30, density=True, color='r', alpha=0.7)
axs[1].set_title('Skewed Distribution')

plt.show()
In this example, we first create a normally distributed set of data, with mean 0 and standard deviation 0.1. We then create a skewed distribution using scipy.stats.skewnorm. The a parameter controls the skewness of the distribution, with positive values indicating right-skew.
Then we plot histograms of these two distributions. The top blue 'Normal Distribution' histogram should show a symmetric bell curve, while the bottom red 'Skewed Distribution' histogram will be skewed to the right.